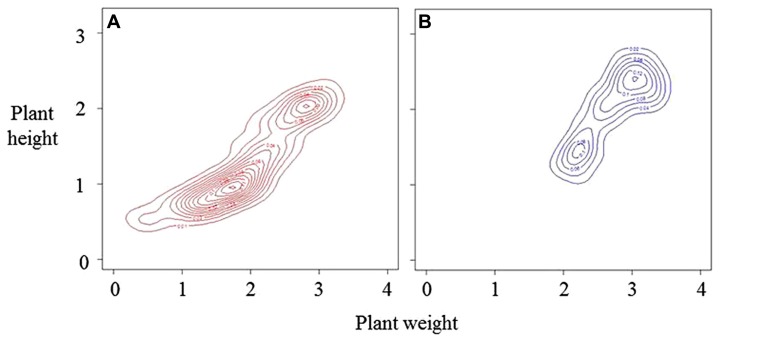
FIGURE 2.
Bivariate distributions of height and weight on the same arbitrary scales for a developing population over two time periods, A the younger stage, and B (based on Turley and Ford, 2011). The distributions are represented by density estimations using kernel smoothing (Wand and Jones, 1995). Both distributions show distinct bimodality. At stage A, small-sized plants are the major mode. During the period of growth between A and B, some 60% of total plants died reducing the number of plants in the small-sized mode.

