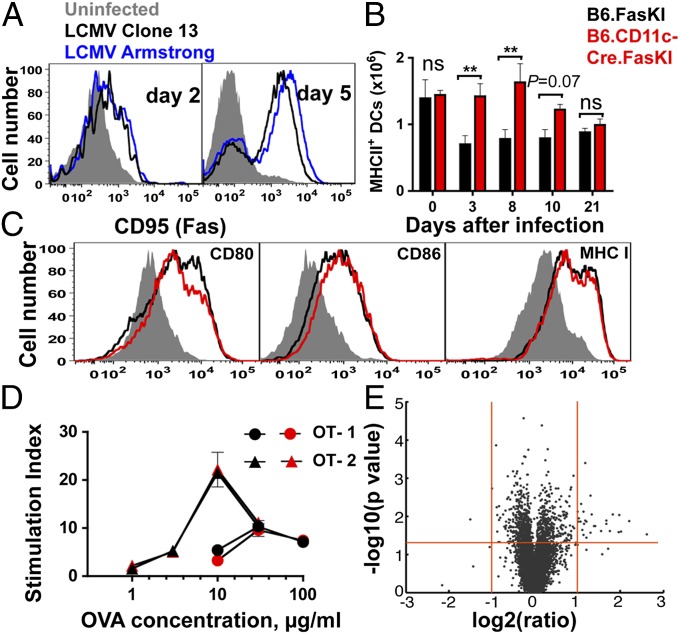
Fig. 2.
Fas is rapidly up-regulated upon LCMV infection and reduces dendritic cell survival. (A) Splenic DCs from B6 mice infected with LCMV-clone 13 or LCMV-Armstrong were analyzed for CD95(Fas) expression at 2 and 5 d after infection. Data represent two independent experiments. (B) LCMV-clone 13–infected B6.FasKI and B6.CD11-Cre.FasKi mice were analyzed at 0, 3, 8, 10, and 21 d after infection, and the total number of splenic DCs were estimated. Data are compiled from two independent experiments with 3–8 mice per time point. Error bars represent SEM. Statistical significance was determined by unpaired Student t test. (*P < 0.05; **P < 0.005; ns, not significant.) (C) DCs from mice in B were analyzed for surface expression of MHC class I, CD80, and CD86 on day 5 after infection. (D) Purified T cells from OT-1 and OT-2 mice were stimulated with indicated doses of OVA protein presented by Mitomycin-treated DCs from B6.FasKI (black symbols) or B6.CD11c-Cre.FasKI (red symbols) mice. Stimulation index is the ratio between 3H-Thymidine incorporation in the presence of OVA vs. incorporation in the absence of antigen. One of two similar experiments is shown. Error bars are SEM. (E) Volcano plot of significance versus change of gene expression between day 5 LCMV-clone 13–infected splenic DCs from B6.FasKI and B6.CD11c-Cre.FasKI mice. The two vertical (red) lines indicate twofold change, and the horizontal (red) line indicates the 0.05 P value level.

