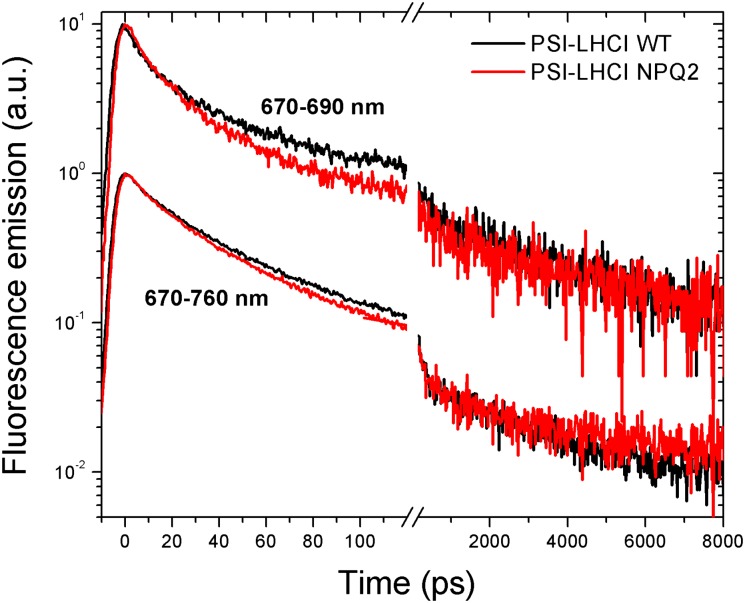
Fig. 3.
Fluorescence decay dynamics of PSI–LHCI supercomplexes. Fluorescence decay dynamics were extrapolated from measurements of Streak camera imaging. Streak camera images were integrated in the spectral ranges of 670–760 and 670–690 nm as indicated in the figure. Excitation was performed at 440 nm.

