Fig. 5.
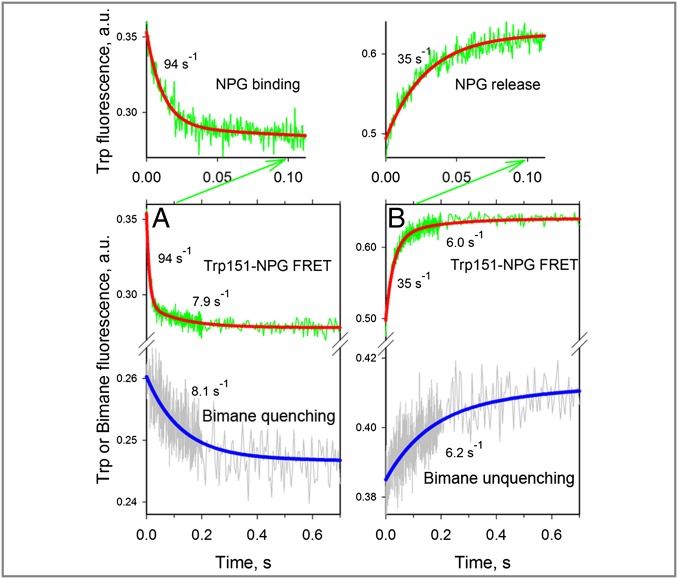
Rates of opening and closing of the cytoplasmic cavity measured in DDM with bimane-labeled mutant N137C/Q340W. All traces were recorded with excitation at 295 nm, and emitted light was collected as described in Fig. 4A using two photomultipliers for simultaneous detection of Trp151→NPG FRET (NPG binding or release) and bimane fluorescence (closing or opening of the cytoplasmic cavity). (A) Mixing protein with 0.2 mM NPG results in quenching of bimane fluorescence (Lower, gray trace) and a decrease of Trp fluorescence (Lower, green trace), with the initial part of the trace (0.1-s scale, green arrow) expanded (Upper). A single-exponential fit of bimane fluorescence change (Lower, blue line) allows estimation of the rate of cavity closure (kobs = 8.1 s−1). The decrease in Trp fluorescence is fitted with a double-exponential equation (red line), which allowed estimation of the NPG-binding rate (kobs = 94 s−1), followed by a much smaller decrease in amplitude with kobs = 7.9 s−1. (B) Dilution of 25 μL of protein containing 0.2 mM NPG by mixing with 250 μL of buffer results in unquenching of bimane fluorescence (Lower, gray trace) and an increase in Trp fluorescence (Lower, green trace), with the initial portion of the trace (0.1-s scale, green arrow) expanded (Upper). A single-exponential fit of the bimane fluorescence change (Lower, blue line) allows estimation of the rate of cavity opening (kobs = 6.2 s−1). The increase in Trp fluorescence is fitted with a double-exponential equation (red line), which allowed an estimate of the rate of NPG release (kobs = 35 s−1), followed by a much smaller increase in amplitude with kobs = 6.0 s−1.

