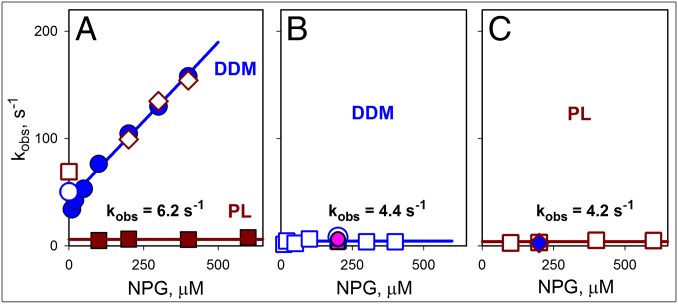
Fig. 7.
Rates of sugar binding and closing of the cytoplasmic cavity. The data shown were obtained for bimane-labeled N137C/Q340W LacY from the stopped-flow measurements described in Figs. 3 B and C and 5 and Fig. S7. (A) Concentration dependence of NPG-binding rates (kobs) measured by Trp151→NPG FRET with protein solubilized in DDM (blue ●), reconstituted into PL (brown ■), or after dissolving the PL in DDM (◇). The koff values for protein in DDM micelles (○) or PL (□) are shown. Kinetic parameters for NPG binding in DDM are kon = 0.3 μM−1⋅s−1 and koff = 43 s−1. Reconstituted protein binds sugar with kobs = 6.2 ± 1.1 s−1. (B) Rates of bimane fluorescence change measured in DDM after mixing protein with NPG (○ and □ with excitation at 295 nm and 380 nm, respectively) or after dilution of protein preincubated with NPG (pink ● and ■ for measurements with excitation at 295 and 380 nm, respectively). The estimated rate of opening/closing of the cytoplasmic cavity in DDM is 4.4 ± 2.0 s−1. (C) Rates of bimane quenching measured after mixing of NPG with protein reconstituted into PL (□, excitation at 380 nm) or with the same PL dissolved in DDM (blue ◆). The estimated rate of cytoplasmic cavity closing for the reconstituted protein is 4.2 ± 1.3 s−1.

