Fig. 2.
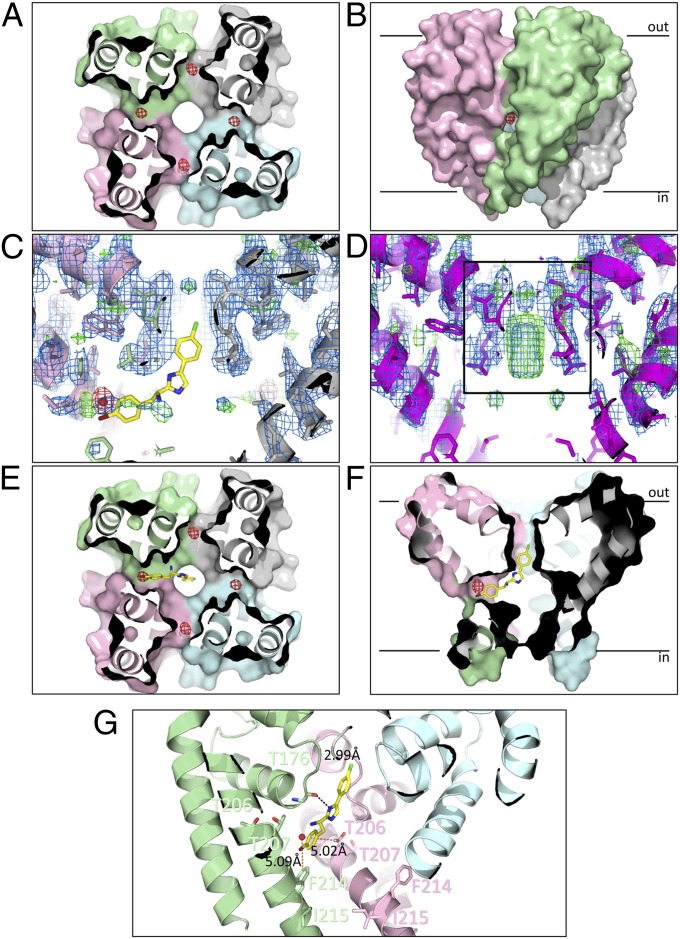
Binding site of PI1 in the NavMs pore. (A) Crystal structure of the NavMs-pore in complex with PI1. The four monomers are depicted in different colors in surface representation. The view is a slice through the middle of the structure, in the cavity region, viewed from the bottom of the pore. The anomalous difference map (which indicates the locations of the bromine atoms at the top of the cavity) is overlaid as a red mesh contoured at 3 σ and corresponds with ∼0.3 occupancy/site. (B) Side view of the pore showing the anomalous difference density location adjacent to the entrance of one of the transmembrane fenestrations, between two monomers. For reference, the black bars indicate the approximate locations of the top and bottom of the bilayer. (C) Side view slice through the middle of the pore, showing the lack of density in the SF (indicated by the black box in D) for the PI1 cocrystals. The protein structure (in cartoon, ribbon, and stick representation) is overlaid with (2Fo-Fc) and (Fo-Fc) difference electron density maps contoured at 1.5 σ (blue) and 3 σ (green), respectively. The anomalous difference map contoured at 5 σ is shown in red. The best docked position of PI1 is shown in stick representation, for reference. (D) View as in C but for the apo crystals. The density in the center of the SF corresponds to sodium ions (28). (E and F) In silico docking results using the apo NavMs-pore structure and PI1. The position of the best predicted site (in stick representation) is overlaid on a surface representation of the protein crystal structure, with the position of the bromine in the cocrystals indicated as a solid red ball) and the anomalous density map (red mesh). The distal end of PI1 protrudes into the bottom of the SF. E corresponds to a side view of a slice through the center of the channel (corresponding to the direction in A), whereas F corresponds to a slice through the center from the perpendicular direction (which corresponds to the direction of the view seen in B). (G) Detailed view of the PI1 binding pocket. The locations of the residues that were mutated for the functional studies (T207 and F214, which effect block, and T206 and I215, which do not), and their distances to the crystallographically-located bromine atom are indicated by orange dashed lines. The hydrogen bond between the imidazole nitrogen of PI1 and the Thr176 main chain carbonyl group predicted from docking is shown as a black dashed line.

