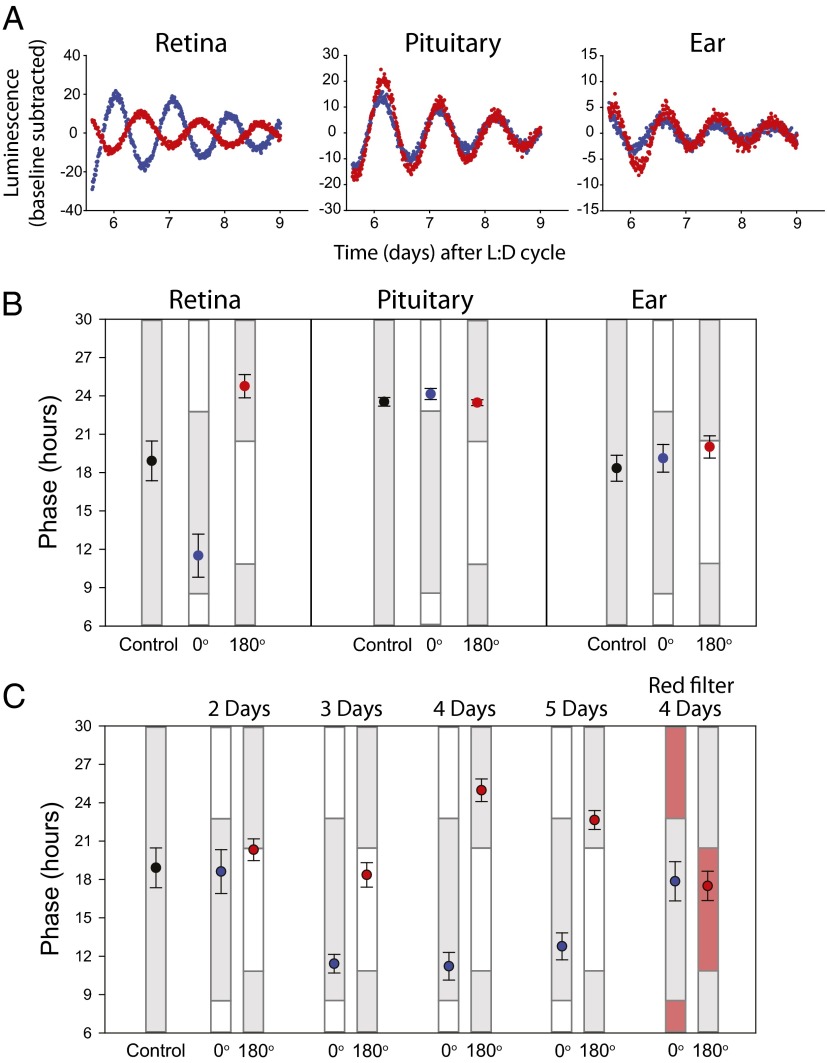
Fig. 1.
The retina is entrained by light/dark cycles in vitro. (A) Per2Luciferase luminescence traces with background luminescence subtracted by using a polynomial fit line with an order of 1. Red and blue traces represent two separate cultures of the specified tissue from the same animal. Traces are recorded in constant darkness after 4 d of light/dark treatment in the 0° (blue) or 180° (red) position in a light/dark clock apparatus. (B) Average time of peak Per2Luciferase luminescence on the first day of constant darkness following a 4-d light/dark treatment (error bars represent 1 SEM) in the 0° (blue) or 180° (red) position. Gray bars indicate times of day when tissues previously experienced dark, and white boxes indicate times of exposure to 5 W/m2 light from LEDs ranging from 417 to 530 nm. Black points represent the average phase (±SEM) of untreated tissues on the fifth day in culture. Retina: control, n = 8; 0°, n = 6; and 180°, n = 6. Pituitary: control, n = 5; 0°, n = 5; and 180°, n = 5. Ear: control, n = 5; 0°, n = 6; and 180°, n = 6. (C) Average time (±SEM) of luminescence as shown in B for retina pairs exposed to 2 d (n = 5), 3 d (n = 5), 4 d (n = 6), or 5 d (n = 5) of a light/dark cycle. (Right) Phases of retinas in clock apparatus but with individual culture dishes covered with a layer of red acetate (n = 5).

