Fig. 3.
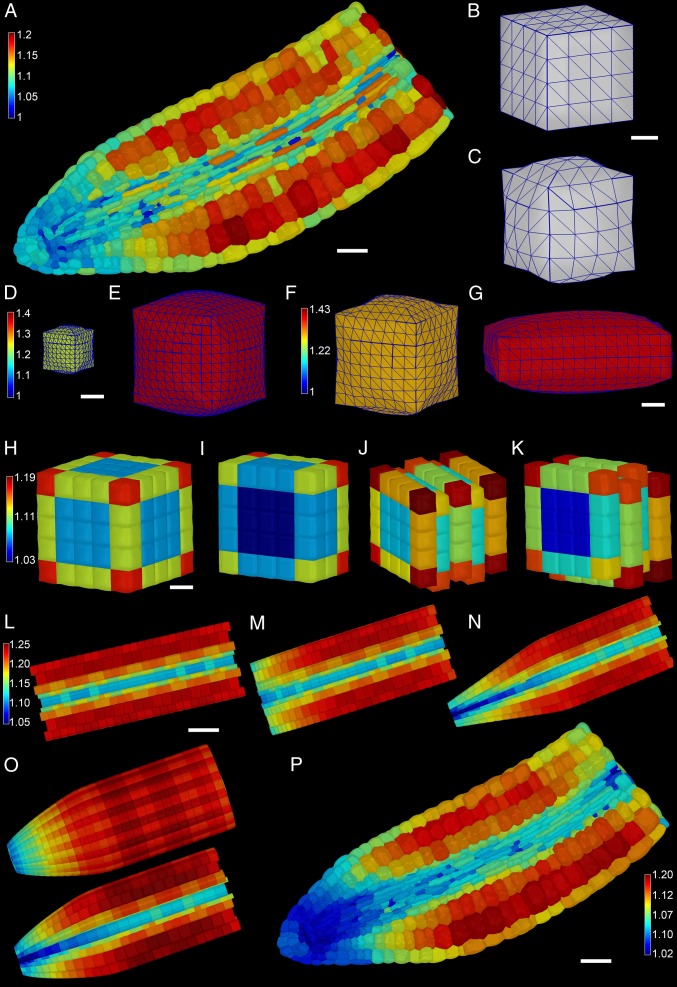
Geometric constraints on cellular expansion, using 3D mechanical models. (A) Three-dimensional mechanical growth simulations using the real cellular geometry derived from an Arabidopsis embryo. (White scale bar, 30 μm.) Colored scale bar shows relative cell expansion. (B and C) An artificially designed square cuboid cell before pressurization (B) and following pressurization (C). (White scale bar in B, 5 mm.) (D and E) An 8,000-μm3 (D) and a 125,000-μm3 (E) cell each pressurized to 5 Bar and colored using the same scale shown in E. (White scale bar in D, 10 mm.) (F and G) A square cuboid (F) and rectangular cuboid (G) cell pressurized to 5 Bar and colored using the scale in F. (White scale bar in G, 5 μm.) (H) Surface view of the expansion of a 5 × 5 x 5 block of cells. (I) Inside view of H. (J) Same as H with the cells staggered one-half between adjacent cell layers. (K) Inside view of J. H–K are colored using scale in H. (White scale bar in H, 20 μm.) (L) An artificially designed embryo shaped as a cylinder. (White scale bar, 50 μm.) (M) The same as L but with shorter cells toward the tip. (N) The same as L but with narrower cells toward the tip. (O) An artificially designed embryo where the cells get progressively shorter and narrower toward the tip, using the same parameters as in M and N, inclusive. The colored scale bar in L indicates relative growth rate, and L–O have the same scale. (P) Actual embryo template geometry heat map colored showing changes in surface area. (White scale bar, 30 μm.)

