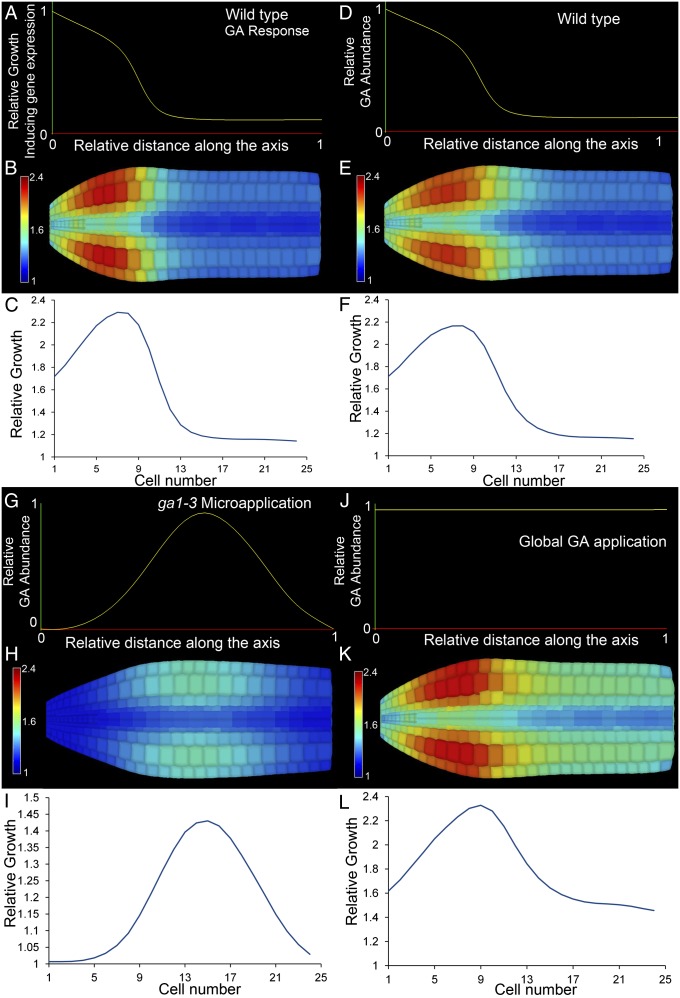
Fig. 4.
Growing 3D FEM simulation of embryo cell expansion in response to the observed growth gene expression gradient. (A) Function used to define the GA signaling output. (B) False-colored axis showing relative cell expansion along the wild-type embryo axis. (C) Graph of relative cortical cell expansion in the embryo in B. GA receptor abundance in D–L used the same function as in A. (D) GA abundance in the wild-type embryo. (E) False-colored axis showing relative cell expansion along the embryo axis in D. (F) Graph of relative cortical cell expansion in the embryo in E. (G) GA abundance in ga1-3 embryos with GA microapplied. (H) False-colored axis of relative cell expansion from G. (I) Graph of relative cortical cell expansion in the embryo in H. (J) GA abundance in ga1-3 embryos with GA applied globally. (K) False-colored axis showing relative cell expansion from J. (L) Graph of relative cortical cell expansion in the embryo in K.

