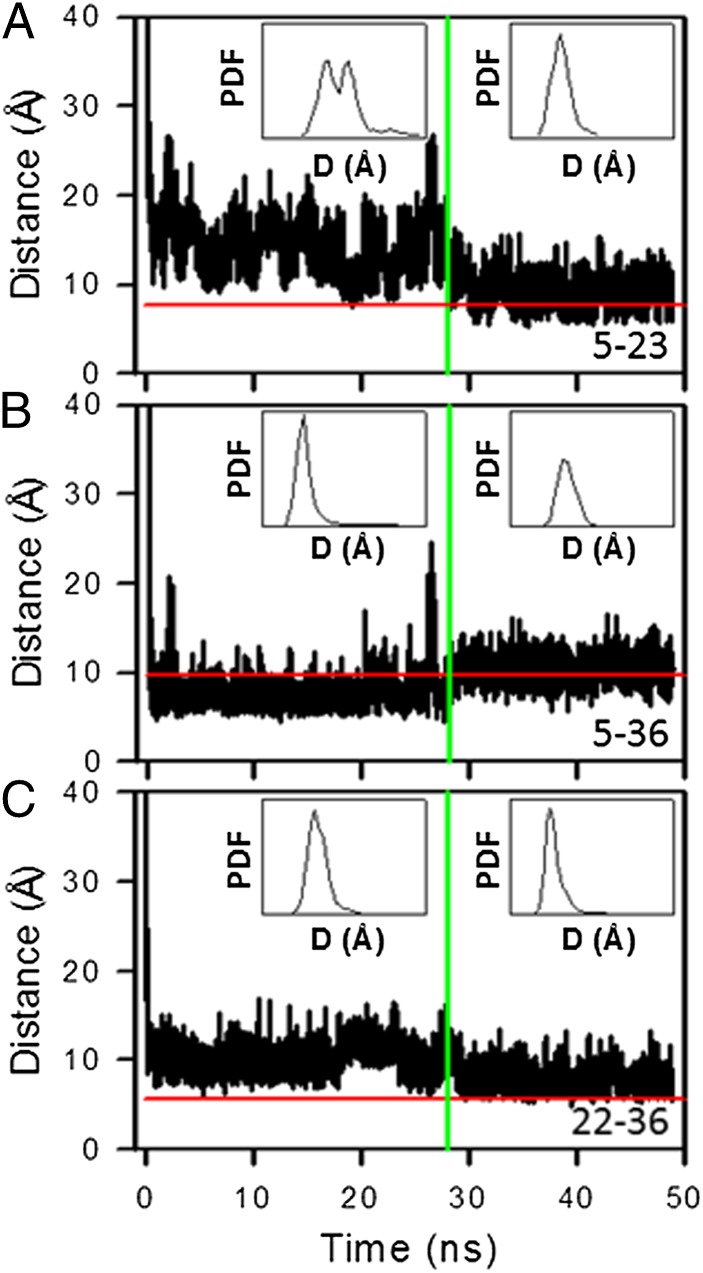
Fig. 5.
(A–C) The distances between Cαs of Phe5–Ile23 (A), Phe5–Leu36 (B), and Phe22–Leu36 (C), as functions of time for a 50-ns time interval (the 0- to 28-ns time interval corresponds to the mirror-image state, and the 28- to 50-ns time interval corresponds to the native state). Insets show the probability distribution functions of the distances (D) between these residues computed for both the mirror-image and the native states. Horizontal red lines correspond to experimental distances (5) between the Cαs of these selected residues. Vertical green lines indicate the time when the protein jumps from the metastable mirror-image state into the native state.

