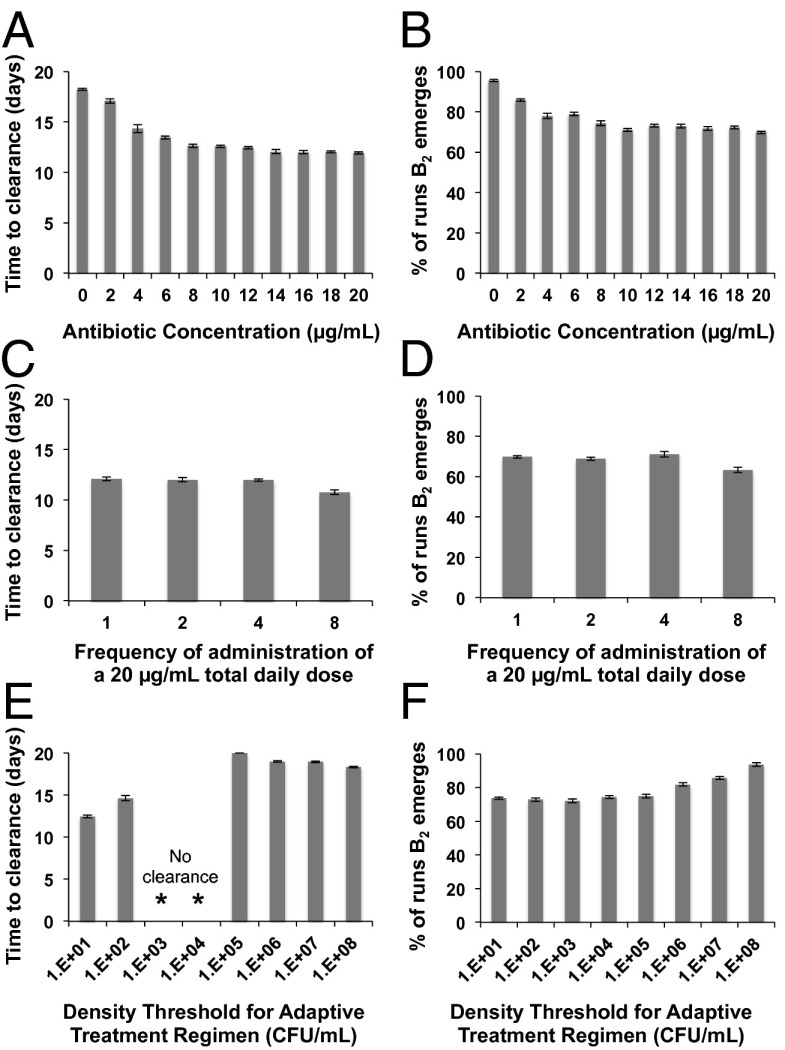
Fig. 3.
The effects of different treatment regimens and pathogen density-dependent (PDD) immune dynamics on the average time to clearance of the infection (left column) and fraction of 100 simulations in which bacteria with intermediate levels of resistance emerge (right column). Means and SEs for 10 independent simulations (left column) and means and SEs for 10 independent simulations each with 100 runs (right column). (A and B) Single daily doses of different concentrations of the antibiotic; (C and D) 20 µg/mL of the antibiotic administered at different frequencies ranging from one dose of 20 µg/mL to eight doses of 2.5 µg/mL per day; (E and F) different density thresholds for the cessation of antibiotic dosing in adaptive treatment regimens, standard treatment of 10 µg/mL per day.

