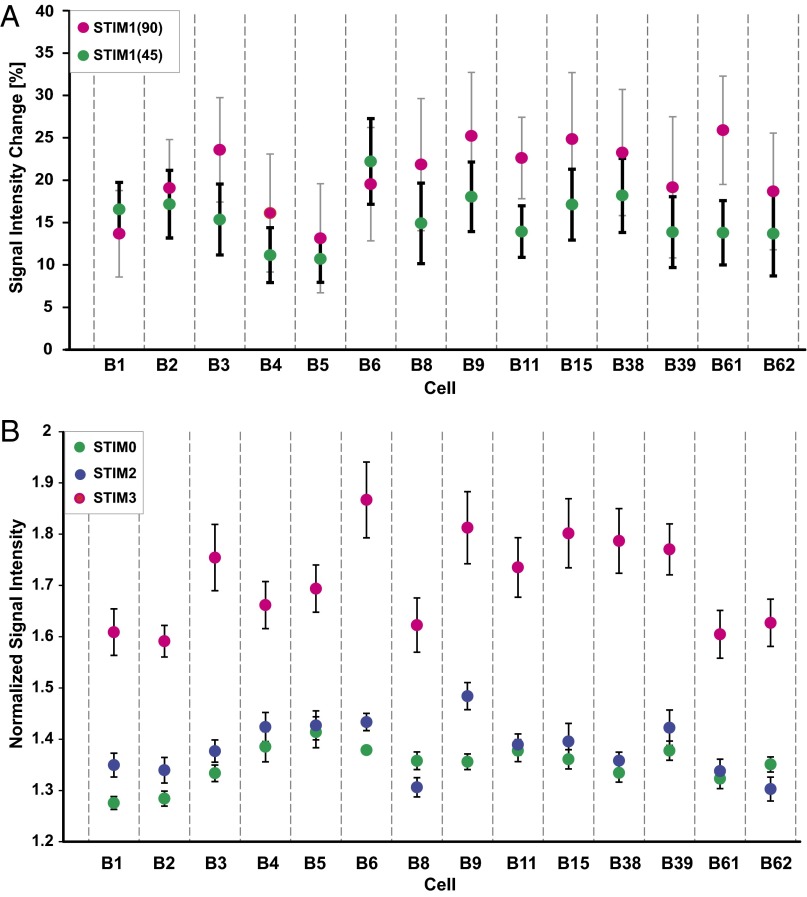
Fig. 3.
The amount of Mn2+ accumulated inside neurons is stimulus-dependent. (A) Percent signal intensity change in STIM1 relative to STIM0 condition [defined as: ] for two different stimulus durations: 45 min in green and 90 min in magenta. (B) Average normalized signal intensity for three stimulation conditions: STIM0 (green; no food stimulus), STIM2 (blue; food-aroused and unfed animals), and STIM3 (magenta; food aroused and fed animals). n = 10 for each data point. The error bars represent the SEM.

