Fig. 5.
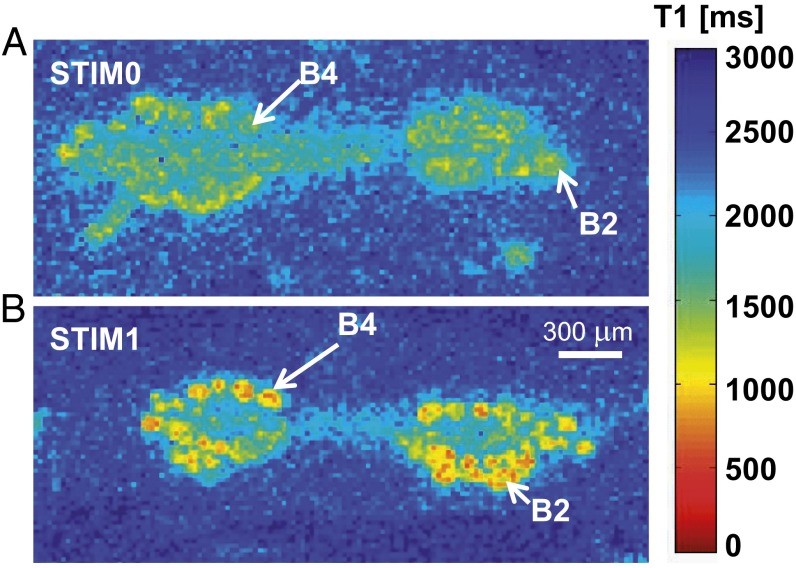
The concentration of intracellularly accumulated Mn2+ can be measured in individual neurons. T1 maps of buccal ganglia coming from (A) a nonstimulated animal (STIM0) and (B) a food-aroused and fed animal (STIM3). Shorter T1 values indicate higher concentrations of Mn2+ corresponding to a higher level of neuronal activity. (Scale bar: 300 μm.)

