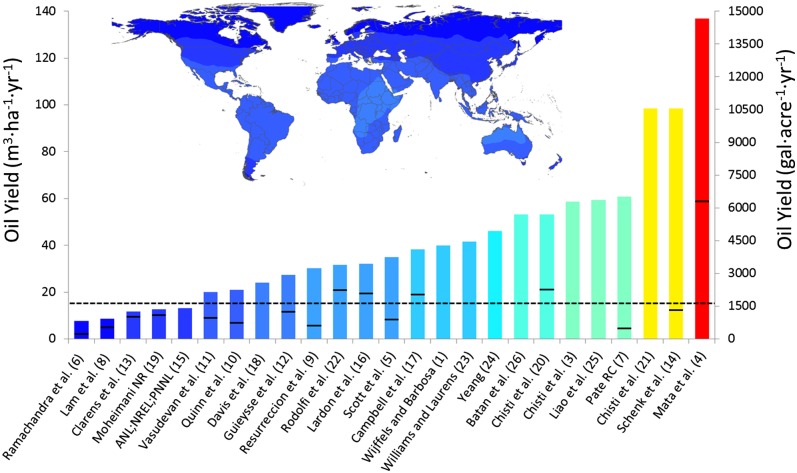
Fig. 4.
Oil yield assumptions found in life cycle, technoeconomic, and scalability assessments compared with the results of this study presented as a global map, Fig. 1 rescaled to capture the range of literature values. Because of the range of productivities reported in some studies, the low end of the range is represented by the black line and the color bar represents the high end reported. The black dashed line represents the world average current near-term lipid productivity of 17 m3·ha−1·y−1 corresponding to a biomass yield of 9.4 g·m−2·d−1 as determined in this study.

