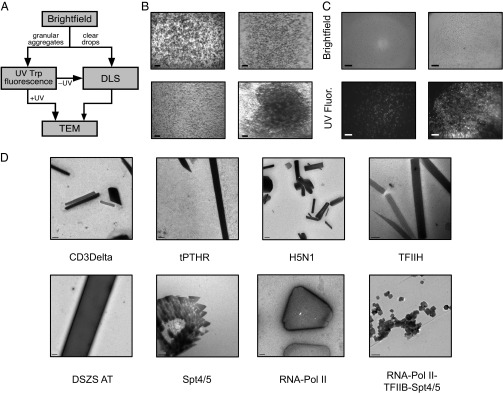
Fig. 1.

(A) Flow chart of the protocol used to identify protein NCs from crystallization drops. (B) Representative images of granular aggregates used for TEM. (C) Brightfield and UV fluorescence of granular aggregates, which can comprise UV-positive, well-differentiated nanoparticles (Left) or UV-positive, diffuse nanoaggregates (Right). (D) Examples of NCs identified by TEM. [Scale bars: (B) 300 μm, (C) 50 μm, (D) CD3Delta, 0.5 μm; tPTHR, 0.5 μm; RNA-Pol II-TFIIB-Spt4/5, 200 nm; TFIIH, 200 nm; DSZS AT, 0.5 μm; Spt4/5, 200 nm; RNA-Pol II, 0.2 μm; H5N1, 0.2 μm.]
