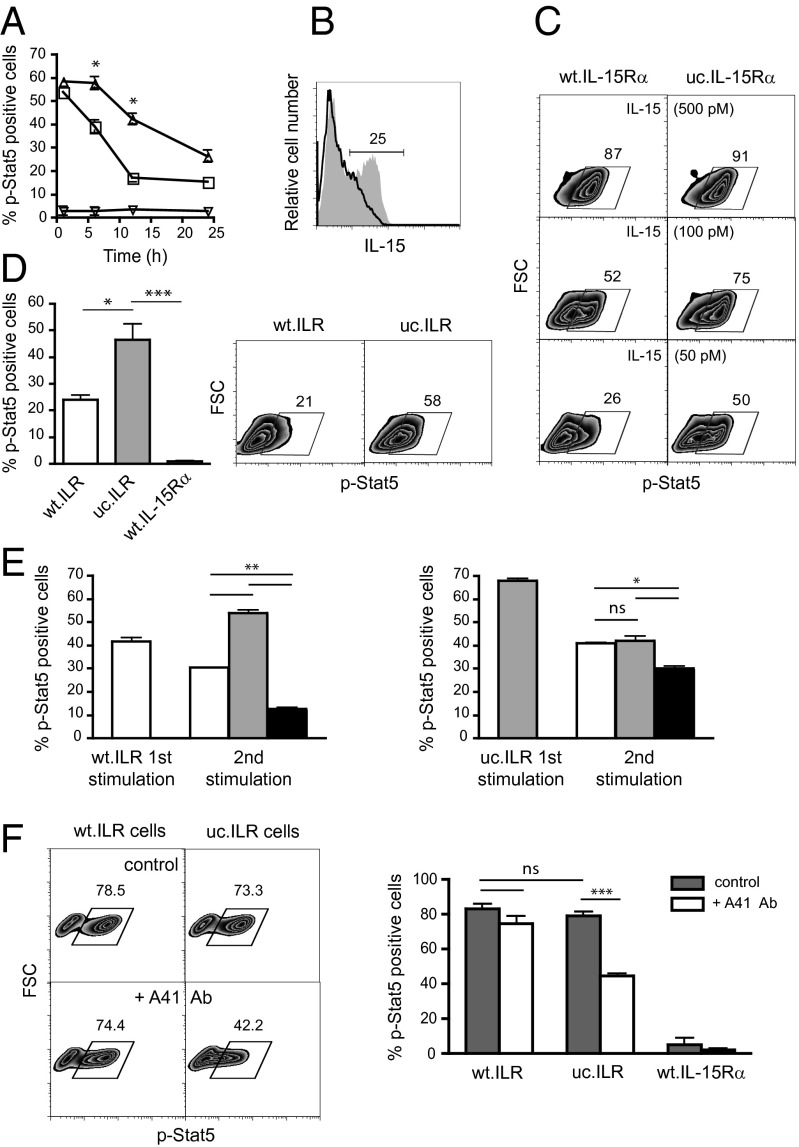
Fig. 4.
Differential dynamics of activation. (A) Flow cytometric analysis of p-Stat5 within Kit225 cells cocultured for indicated time points with transiently transfected wt.IL-15Rα (open squares) or uc.IL-15Rα (open triangles) HeLa cells loaded with 100 pM IL-15 or not (open inverted triangles). (B) Representative flow cytometric analysis of IL-15 expression at the surface of transiently transfected wt.IL-15Rα or uc.IL-15Rα HeLa cells loaded with 100 pM IL-15 after 24 h. (C and D) Representative flow cytometric analysis of p-Stat5 within Kit225 cells cocultured for 24 h with wt.IL-15Rα or uc.IL-15Rα loaded with 50, 100, and 500 pM IL-15 (C) or with wt.ILR, uc.ILR and IL-15Rα HeLa cells (D). Graph in D, Left shows a pool of four independent experiments. (E) Flow cytometric analysis of p-Stat5 within Kit225 cells prestimulated for 3 h with wt.ILR (Left) or uc.ILR HeLa cells (Right) and restimulated for 1 h with wt.ILR (white bars), uc.ILR (gray bars) or wt.IL-15Rα (black bars) HeLa cells. (F Left) Representative flow cytometric analysis of p-Stat5 within Kit225 responding cells, pretreated with or without A41 anti-CD122 antibody, then washed to remove unbound antibody, and cocultured for 1 h with wt.ILR, uc.ILR or wt.IL-15Rα HEK-293 presenting cells. (F Right) Graph shows a pool of at least three independent experiments. Numbers shown in zebra plots indicate the percentage of cells in the indicated gates. ns, not significant; *P < 0.05; **P < 0.01; ***P < 0.001.

