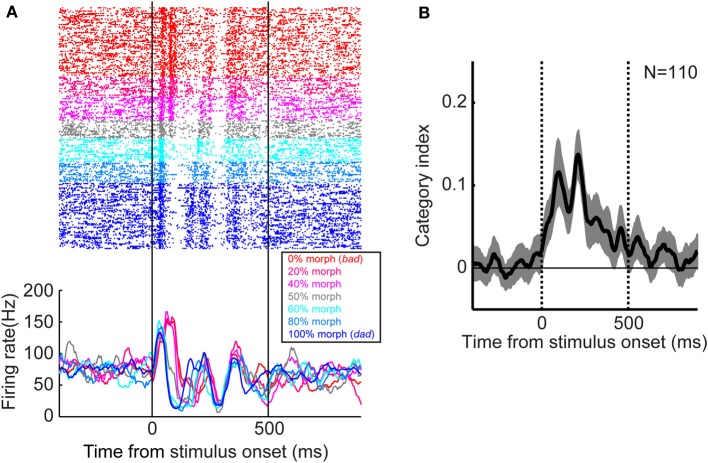
Figure 2.
Categorical neural activity in the monkey lateral belt during categorization of speech sounds. (A) An example of the activity of a lateral belt neuron. The speech sounds were two human-speech sounds (“bad” and “dad”) and their morphs. Neural activity is color-coded by morphing percentage of the stimulus as shown in the legend. The raster plots and histograms are aligned relative to onset of the stimulus. (B) Temporal dynamics of the category index at the population level. Category-index values >0 indicate that neurons categorically represent speech sounds (Freedman et al., 2001; Tsunada et al., 2011). The thick line represents the mean value and the shaded area represents the bootstrapped 95%-confidence intervals of the mean. The two vertical lines indicate stimulus onset and offset, respectively, whereas the horizontal line indicates a category-index value of 0. The figure is adopted, with permission, from Tsunada et al. (2011).

