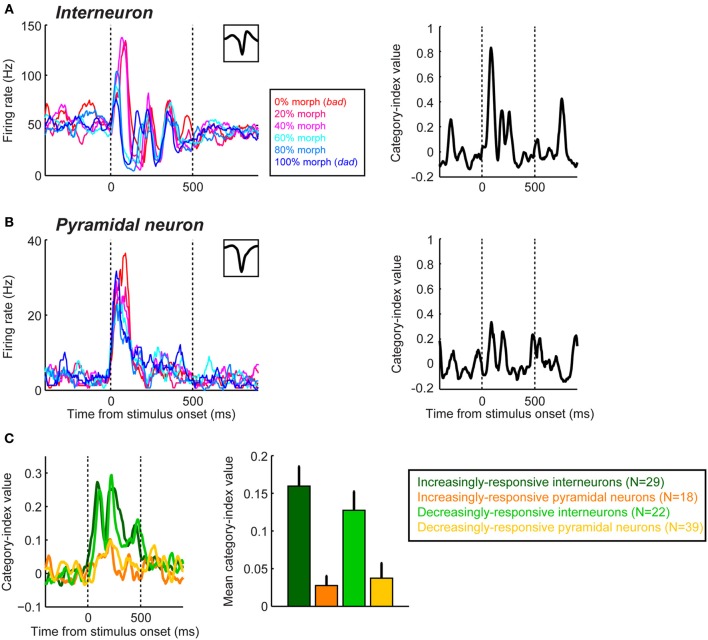
Figure 4.
Category sensitivity in interneurons is greater than that seen in pyramidal neurons during categorization of speech sounds in the auditory cortex. The plots in the left column of panel (A,B) show the mean firing rates of an interneuron (A) and a pyramidal neuron (B) as a function of time and the stimulus presented. The stimuli were two human-speech sounds (“bad” and “dad”) and their morphs. Neural activity is color-coded by morphing percentage of the stimulus as shown in the legend. The inset in the upper graph of each plot shows the neuron's spike-waveform. The right column shows each neuron's category-index values as a function of time. For all of the panels, the two vertical dotted lines indicate stimulus onset and offset, respectively. (C) Population results of category index. The temporal profile (left panel) and mean (right) of the category index during the stimulus presentation are shown. Putative interneurons and pyramidal neurons were further classified as either “increasingly responsive” or “decreasingly responsive” based on their auditory-evoked responses. Error bars represent bootstrapped 95% confidence intervals of the mean. The figure is adopted, with permission, from Tsunada et al. (2012).

