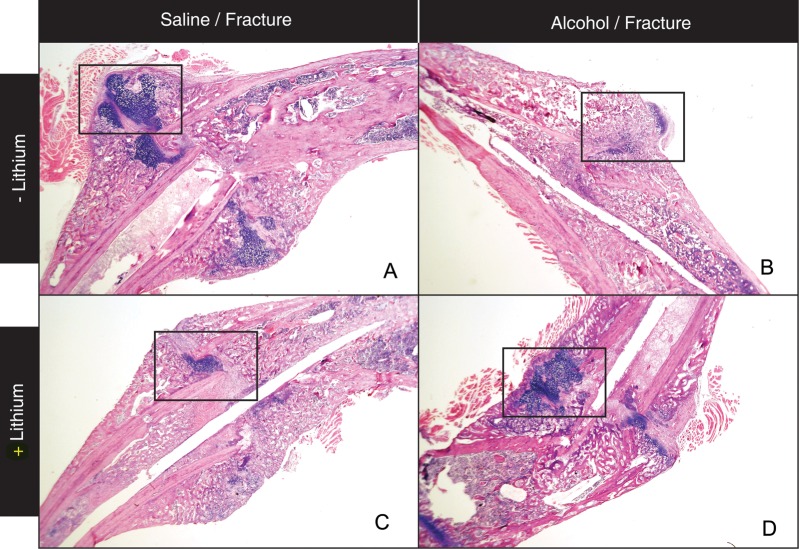
Fig. 2.
Representative photomicrographs of H & E stained fracture callus sections at Day 14 post-fracture (×40). (A) Control mouse. (B) Binge alcohol-treated mouse. (C) Lithium chloride-treated mouse. (D) Binge alcohol and lithium chloride-treated mouse. Higher magnification of the boxed areas are seen in Fig. 3.

