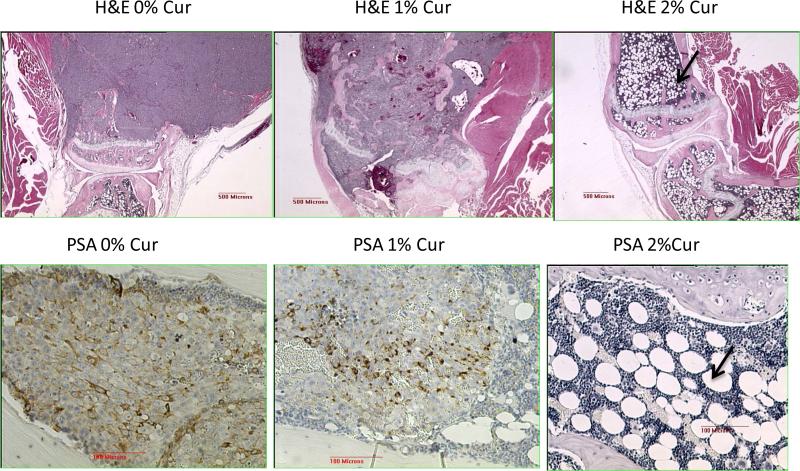
Figure 3.
Representative light microscopic analyses done on the tumor samples. The top panel represent the bone sections stained with H & E. The 0% Cur (0% curcumin in diet) shows stained tibia with a very large tumor mass which has not invaded the cartilaginous growth plate. The bone section with 1% curcumin containing diet shows the tibia that contains a mix of tumor and a few bone marrow cells confined within the cortical bone and the growth plate and the tumor growth is not as intense as in the 0% cur panel Remarkably, the section of the bone harvested from an animal receiving 2% curcumin containing diet shows no tumor growth in the tibia. A fatty marrow is seen in both bones (tibia and femur) as well as a normal bone structure (indicated by arrow). The bottom panels show the immunostaining for the presence of prostate specific antigen (PSA) positive cells. This panel shows the decreased staining for PSA as the curcumin in the diet increases. In the left panel (0% curcumin in diet), within the tumor, strong staining is seen in the tumor cell population. The nuclei of the tumor cells are counterstained light blue. In the middle panel, which represents the 1% curcumin in the diet, the PSA staining was not as marked as in the 0% cur panel and also not completely eliminated. In the right panel (2% curcumin in diet), there is virtually no stain for PSA and the counterstain highlights the presence of extensive fatty marrow cells (adipocytes with a fatty globular structure).

