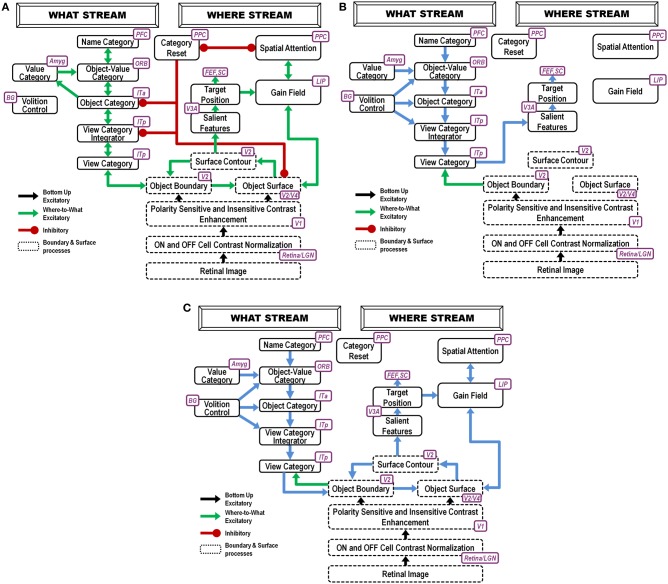
Figure 1.
ARTSCAN Search diagram. The dashed boxes indicate boundary and surface processes. (A) Category learning. The arrows represent the excitatory cortical processes from Where cortical stream to What cortical stream whereby invariant category learning and recognition, and reinforcement learning, occur. The connections ending in circular disks indicate inhibitory connections. (B) Direct pathway of top-down primed search from the What to the Where cortical stream. (C) Indirect pathway of top-down primed search from the What to the Where cortical stream. In both (B) and (C), the green arrows represent bottom-up image-driven processes and the blue arrows represent top-down processes from What cortical stream to Where cortical stream. See Figures 5, 6 and surrounding text for more details about the temporal progression of top-down searches. ITa, anterior part of inferotemporal cortex; ITp, posterior part of inferotemporal cortex; PPC, posterior parietal cortex; LIP, lateral intra-parietal cortex; LGN, lateral geniculate nucleus; ORB, orbitofrontal cortex; Amyg, amygdala; BG, basal ganglia; PFC, prefrontal cortex; SC, superior colliculus; V1 and V2, primary and secondary visual areas; V3 and V4, visual areas 3 and 4.

