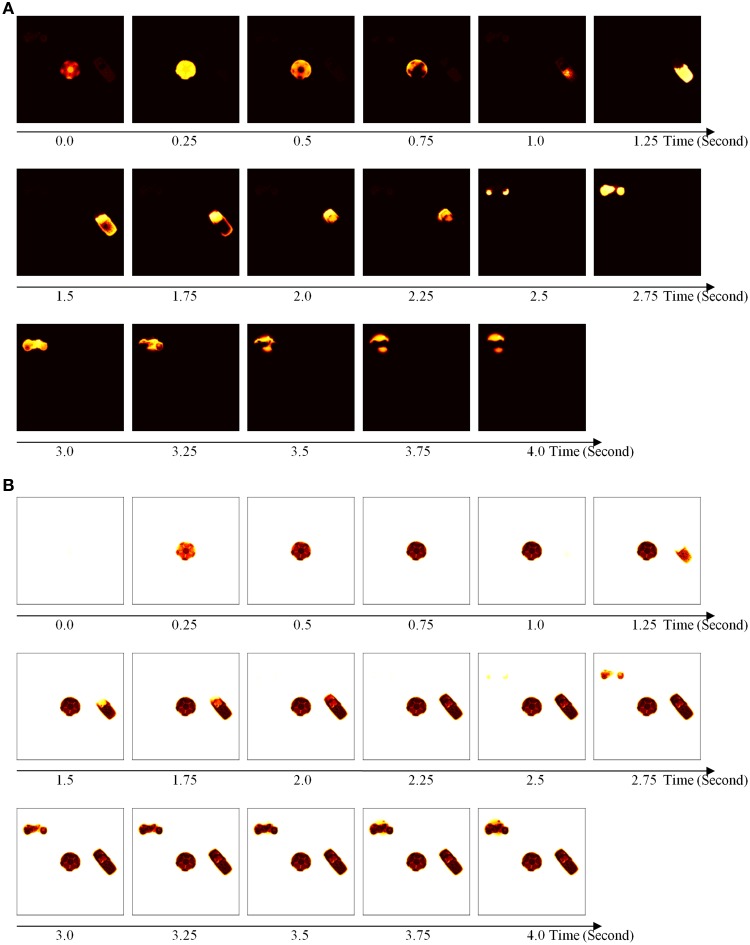
Figure 9.
Temporal dynamics of model simulations in spatial attention map and corresponding habituative transmitter representation. The input to the simulation contains three objects: a soccer ball, a cellphone, and a motorcycle (see Figure 8B). Each slice represents neural activity at each time step. Darker colors represent lower values. (A) Spatial attention map activity in time series when the attentional shroud forms around the attended object. In this case, shroud formation travels from soccer to ocellphone and then to motorcycle. (B) Habituative transmitter levels during the times corresponding to (A).

