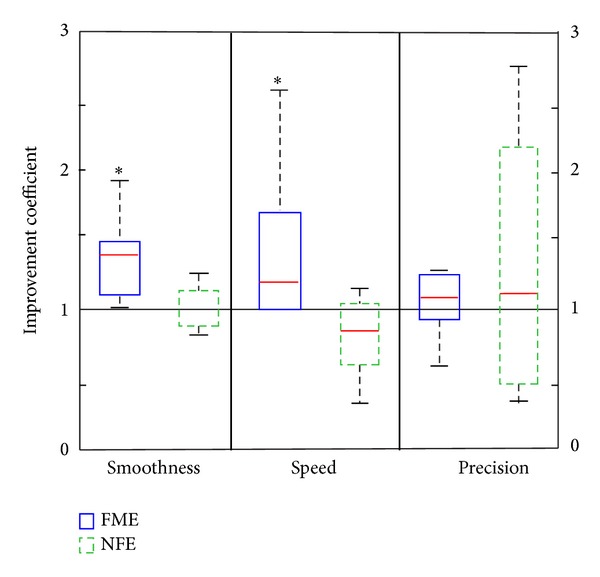
Figure 3.

Box and whiskers plot of smoothness, speed, and precision improvement coefficients for FME and NFE groups. The black line denotes the improvement coefficient of 1 (equal result before and after treatment). Data with statistically significant difference is marked by *.
