Figure 4.

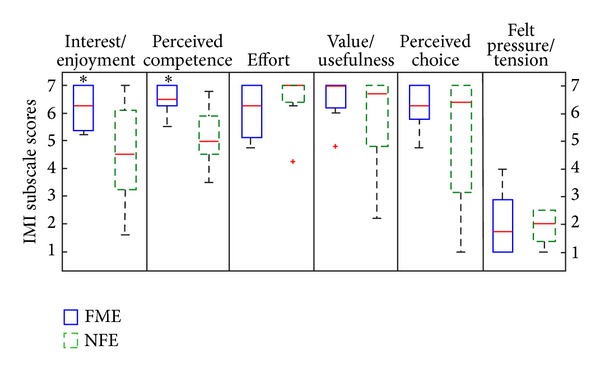
Box and whiskers plot of IMI subscale scores for FME and NFE groups; score range from 1 = not at all true to 7 = very true. Data with statistically significant difference is marked by *. Outliers are marked with a red +.

Box and whiskers plot of IMI subscale scores for FME and NFE groups; score range from 1 = not at all true to 7 = very true. Data with statistically significant difference is marked by *. Outliers are marked with a red +.