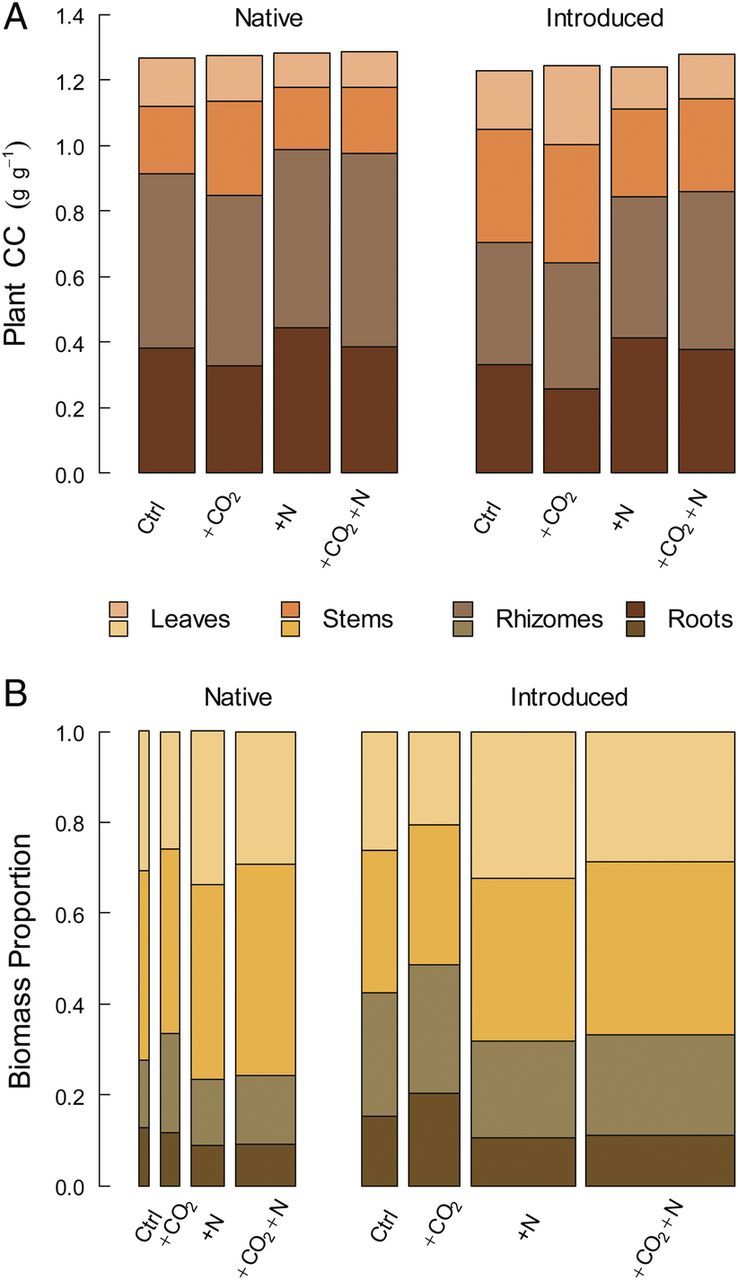
Figure 2.

Partitioning of (A) plant-level CCs and (B) plant biomass by organ type for native and introduced Phragmites under each of the environmental treatment combinations evaluated in this experiment. Mean values for the replicate individuals within each treatment are shown. The widths of bars in (B) are scaled to the total biomass produced across treatments.
