Figure 1.

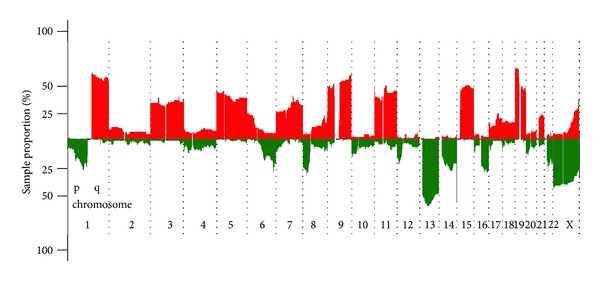
Graphical summary of copy number abnormalities in cohort of 91 multiple myeloma patients. Green color represents areas of loss; red corresponds with areas of gain of genetic material.

Graphical summary of copy number abnormalities in cohort of 91 multiple myeloma patients. Green color represents areas of loss; red corresponds with areas of gain of genetic material.