
Figure 1.
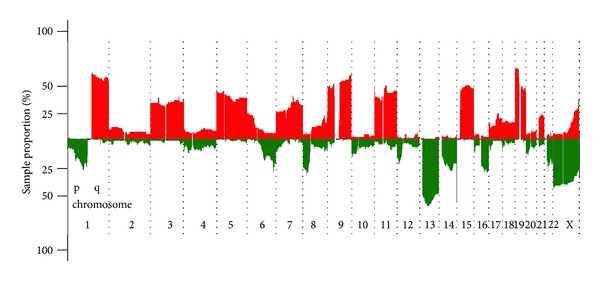
Graphical summary of copy number abnormalities in cohort of 91 multiple myeloma patients. Green color represents areas of loss; red corresponds with areas of gain of genetic material.
Official websites use .gov
A
.gov website belongs to an official
government organization in the United States.
Secure .gov websites use HTTPS
A lock (
) or https:// means you've safely
connected to the .gov website. Share sensitive
information only on official, secure websites.
Graphical summary of copy number abnormalities in cohort of 91 multiple myeloma patients. Green color represents areas of loss; red corresponds with areas of gain of genetic material.