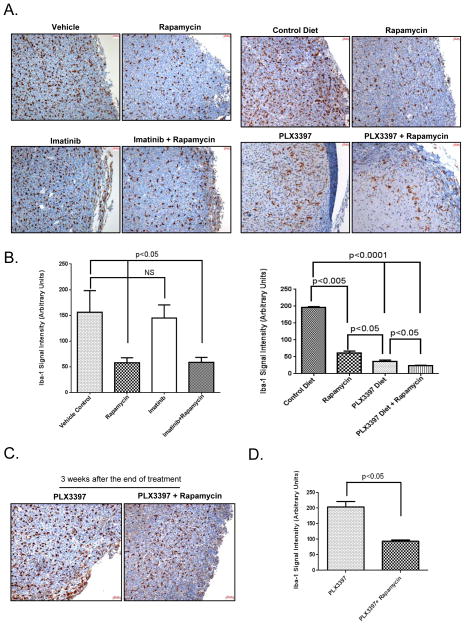
Figure 5. Effect of Imatinib and PLX3397 and/or Rapamycin on Iba-1.
A. Xenograft tissues obtained from mice at the end of 3-week treatment with the indicated drugs were stained immuno-histochemically using Iba-1 antibody. Scale bar (50μm) is shown in the right hand corner of each image. Images from a tumor obtained at the end of 3 week treatment from a representative experiment reproduced at lease three independent times are shown. B. Iba-1 signal (brown staining) was quantitated using MetaMorph image analysis software (Molecular Devices). Iba-1 signal was quantified from at least 3 different high power fields and plotted as arbitrary intensity units. (NS=Not Significant). Quantitation of Iba-1 signal from a tumor obtained from a representative experiment reproduced at lease three independent times is shown. C. Xenograft tissues obtained at the end of 1 week after stopping the drug treatment were stained immuno-histochemically using Iba-1 antibody. Scale bar (50μm) is shown in the right hand corner of each image. Images of a tumor obtained from a representative experiment reproduced at lease two independent times are shown. D. Iba-1 signal (brown staining) was quantitated using MetaMorph image analysis software (Molecular Devices). Iba-1 signal was quantified from at least 3 different high power fields and plotted as arbitrary intensity units. Quantitation of Iba-1 signal from a tumor obtained from a representative experiment reproduced at lease two independent times is shown.

