
Figure 3.
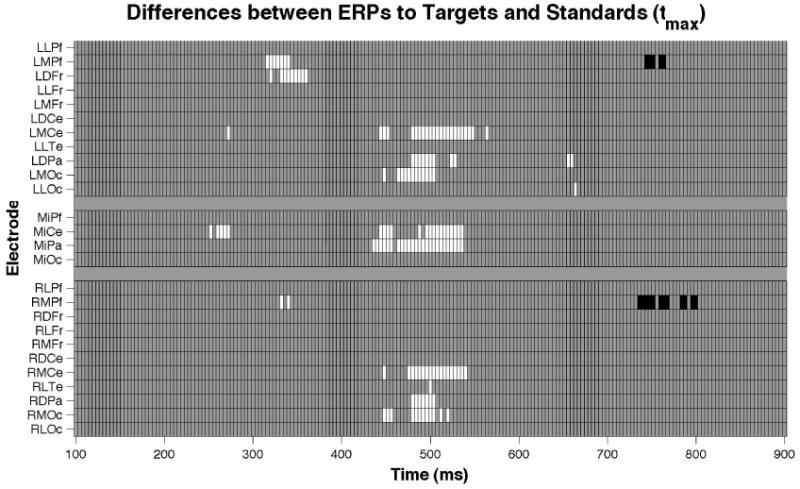
Raster diagram illustrating significant differences between ERPs to targets and standards from a visual oddball task according to a tmax permutation test. White and black rectangles indicate electrodes/time points in which the ERPs to targets are more positive and negative, respectively. Grey rectangles indicate electrodes/time points at which no significant differences were found. Note that the electrodes are organized along the y-axis somewhat topographically. Electrodes on the left (e.g., Left Lateral Prefrontal-LLPf) and right (e.g., Right Lateral Prefrontal-RLPf) sides of the head are grouped on the figure's top and bottom, respectively. Midline electrodes (e.g., Midline Central-MiCe) are shown in the middle. Within those three groupings, y-axis top-to-bottom corresponds to scalp anterior-to-posterior. Five effects are apparent: a P2 effect at MiCe around 250 ms, a left frontal effect around 325 ms, a P3 effect at central and posterior electrodes from 440-540 ms, a left posterior effect around 660 ms, and a slow wave effect at medial prefrontal electrodes around 750 ms.