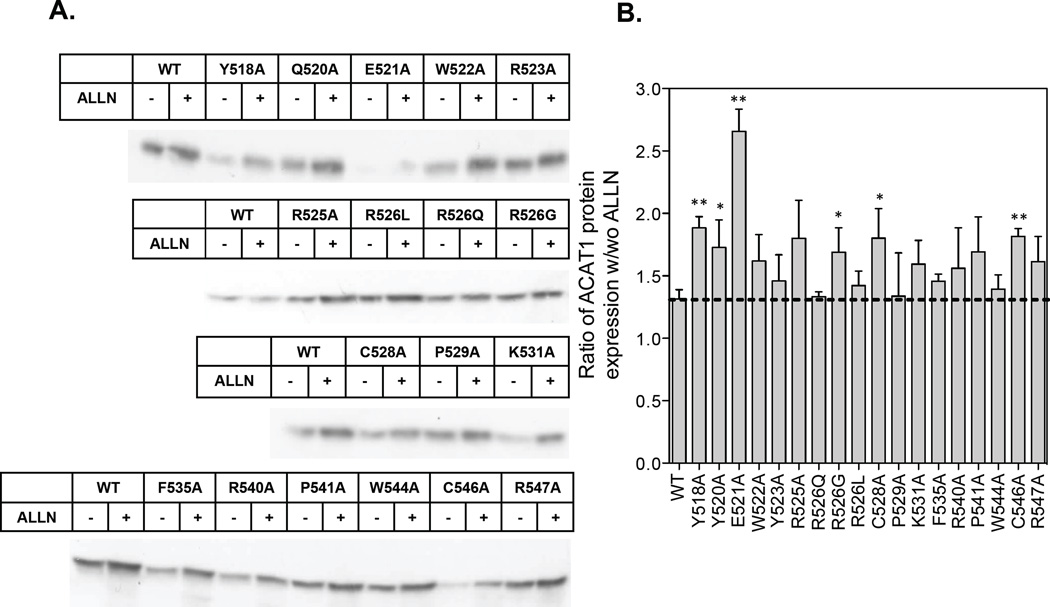
Figure 3. Effect of ALLN on hACAT1 protein expression levels.
The cell preparations prepared in the same manner as described in Fig. 2 were treated without or with ALLN to monitor ACAT protein expression by western analysis. For each well, the entire cell lysates with and without ALLN treatment were loaded. A. Relative WT or mutant hACAT1 protein expression levels with or without 100uM ALLN treatment for 16 hr. B. Quantification of results from A; shown as ratios of band intensity with ALLN versus band intensity without ALLN. Results reported are means ± SEM; for A, results are from one single experiment representative of three separate experiments. For B, results are averages of three separate experiments. The p values were obtained by comparing the ratio values of individual mutant hACAT1s protein expression vs the ratio value of WT hACAT1 protein expression. * P<0.05; ** P<0.01

