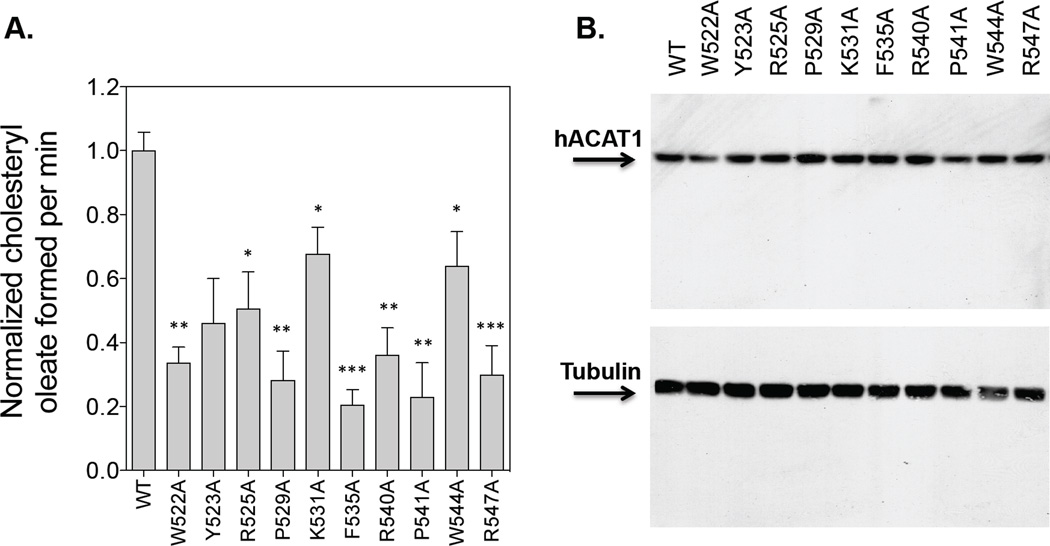
Figure 4. Enzyme activities of WT hACAT1 or hACAT1s with mutations in the C-terminal loop.
The hACAT1 is identified as a single band at 50 kDa. For A, the hACAT1 mutant activities are measured in the same manner as described in Fig. 2. The WT hACAT1 activity is set as 1.0. The results reported are means ± SEM and are average of two separate experiments. For B, the ACAT1 and tubulin protein expression by western blot analysis were from one single experiment representative of two separate experiments. The p values were obtained by comparing values of individual mutant hACAT1s vs value of WT hACAT1. * P<0.05; ** P<0.01; * P<0.001.

