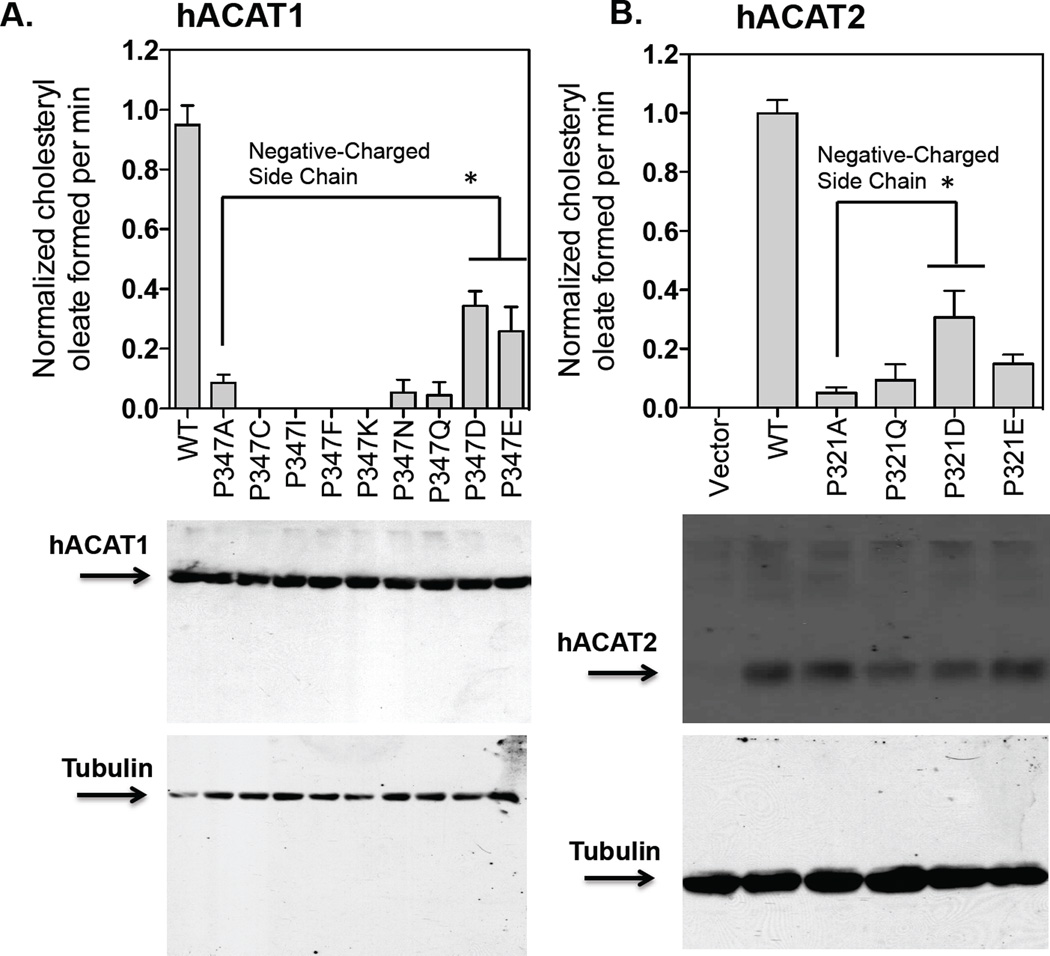
Figure 6. Relative protein expression and enzyme activity of P347 mutants in hACAT1, and P321 mutants in hACAT2.
The experiments were carried out in the same manner as described in Fig. 5 with P347 mutants shown in A. and with P321 mutants as shown in B. The hACAT1 and hACAT2 western blots as shown are from a single experiment representative of two separate experiments. For enzyme activity measurement, results reported as means ± SEM and are averages of two separate experiments. The p values were obtained by comparing values of individual mutant hACAT1 or hACAT2 vs value of hACAT1(P347A) or value of hACAT2(P321A). * P<0.05.

