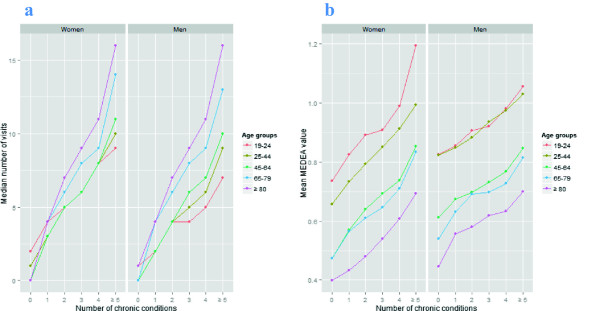
Figure 2.

Relation between number of chronic conditions and median number of visits (2a) and the mean deprivation value (2b), stratified by age group (years) and sex. In this figure, the X-axis shows the number of chronic conditions in both figures. The Y-axis shows the median number of visits (2a) and mean value on the deprivation index (0.4, Least deprived; 1.2, most deprived) (2b) by sex and age group (colour-coded lines).
