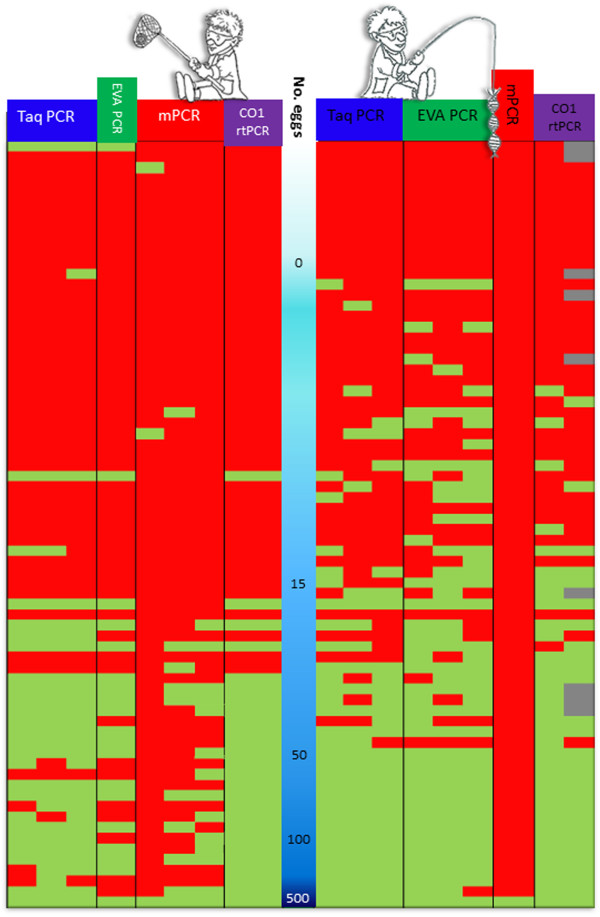
Figure 3.

Depicting results from batches α2 egg sieving and β2 DNA-fishing ordered by number of eggs (shown with the increasing intensity of the blue gradient from zero eggs to 500+ eggs). Individual replicate results are marked either as negative (red) or positive (green) after being analysed using the multiplex PCR (mPCR), Taq-PCR, EVA-PCR and CO1rtPCR. Batch α2 is on the left side of the blue gradient whilst β2 is on the right side of the central blue column. Any greyed positions indicate replicates which were not available due to lack of DNA.
