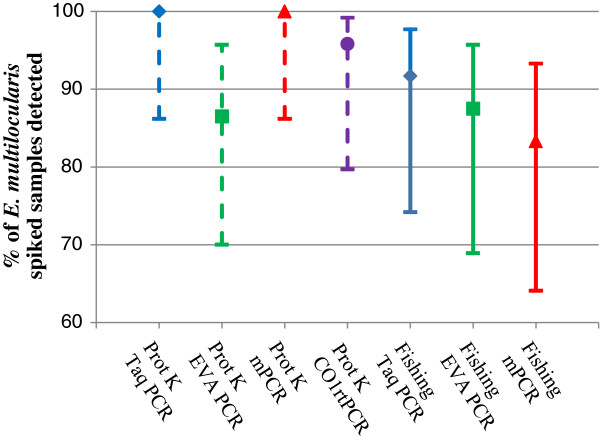
Figure 4.

Results from analyses of results from batches α1 and β1, eggs only. The Y-axis shows the percentage of E. multilocularis egg spiked samples that were detected by each of four PCR methods (Taq-PCR blue diamond; EVA-PCR green square; mPCR red triangle; and CO1rtPCR purple circle), after using two different DNA extraction methods – egg sieving (dotted line, N = 24) and DNA-fishing (solid line, N = 24). The 95% confidence interval is shown for the detection level and given that all overlap; no significant differences were seen between the different methods with samples containing eggs only, with no inhibitors. The CO1rtPCR was run on α1 samples only.
