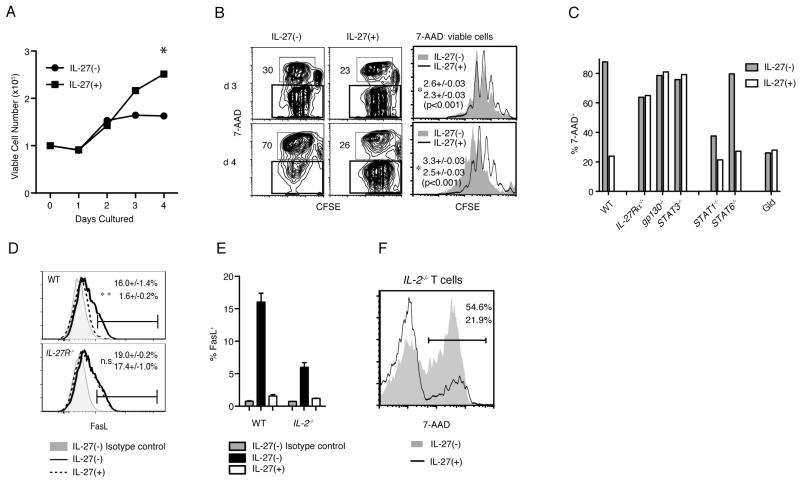
Figure 3.
IL-27 inhibits AICD through STAT3 signaling upstream of FasL-Fas. 1×10⁵ CFSE-labeled naïve CD4+ T cells were stimulated with plate-bound anti-CD3ε and soluble anti-CD28 mAbs in the absence or presence of 10ng/ml rIL-27, as indicated in each panel. (A) Viable cell numbers identified with trypan blue, averaged from 3 culture wells at each time point. The figure represents data compiled from 3 independent experiments. (B) Representative contour plots at day 3 (top) and day 4 (bottom) analyzing the proliferation, measured by CFSE dilution, and cell death, by staining with 7-AAD, of the activated T cells. Numbers in each plot represent the percentage of 7AAD+ cells that underwent at least one division. Representative histograms (right) show the CFSE dilution of 7-AAD− viable cells gated in the contour plots. The numbers in the histograms are the averaged proliferation indexes of activated cells in the absence (top number in both panels) and presence (bottom numbers) of rIL-27. (C) Sorted CD4+CD45RBhigh cells from the indicated mouse spleens were stimulated as above. The percentages of 7-AAD+ cells, identified as in (B), are shown at day 4 of culture. Data are representative of 2 independent experiments. (D) Flow cytometric analyses showing FasL expression by WT (top) and IL-27R−/− (bottom) cells at day 2 of stimulation. Numbers represent the percentage of FasL+ cells in the absence (top) and presence (bottom) of rIL-27, averaged from 3 independent experiments. (E) FasL expression by WT and IL-2−/− cells, which was determined as Fig. 3D. (F) 7-AAD staining of activated IL-2−/− CD4+ T cells in the presence (solid line) and absence (shaded contour, no line) of rIL-27. Numbers represent the percentage of 7-AAD+ cells among the stimulated cells.

