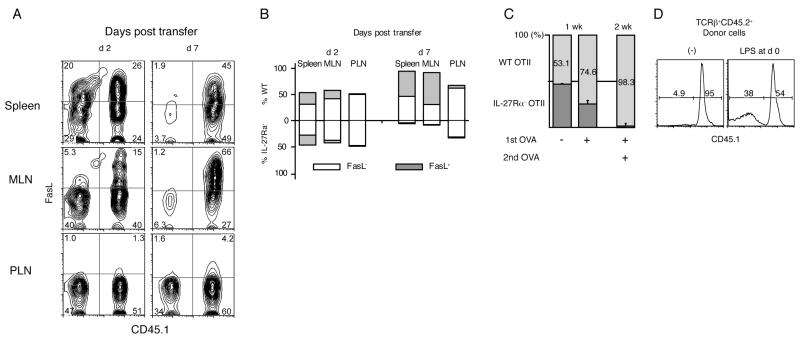
Figure 4.
IL-27 mediated enhancement of CD4 T cell survival involves a cell intrinsic mechanism. (A-C) 5×10⁵ each of WT (CD45.1+) and IL-27Rα−/− (CD45.1−) cells were co-injected intravenously to Rag1−/− mice. Cells were harvested from spleen, MLN and PLN at days 2, 7 and 14. (A) Representative contour plots of CD4+TCRβ+ cells stained for FasL and CD45.1. Numbers represent the percentage of the cells in each quadrant. Data are representative of one of two independent experiments with three recipients each time. (B) Skewed expansion of the donor cell populations by 7 days post transfer. Bars represent the total (= 100%) of CD45.1+ WT (above 0) and CD45.1− IL-27Rα−/− (below 0) cells averaged from 3 recipients. The percentage of FasL+ cells in each cell population is shown as the shaded portion of the bars (C, D) 5×10⁵ each of an equal number of sorted, naïve CD45.1+CD45.2+ WT and CD45.1−CD45.2+ IL-27Rα−/− OTII T cells were co-injected to CD45.1+CD45.2− recipients in the absence and presence of OVA as indicated. (C) Bars represent the ratios of WT and IL-27Rα−/− cells in splenic CD4+CD45.2+ donor T cells analyzed 1 week (left and middle) and 2 weeks (right) post transfer (error bars; s.d.). Mice analyzed 2 weeks post transfer received an additional intraperitoneal OVA injection at day 7. Numbers represent the percentage of WT cells in the CD4+CD45.2+ donor population. (D) Histograms (bottom panels) represent CD45.1 staining of CD45.2+TCRβ+ donor cells. Some recipients (right panel) received LPS at the same time as the donor cells. Numbers represent the percentage of CD45.1+ (WT) and CD45.1− (IL-27Rα−/−) cells, averaged from 3 mice.

