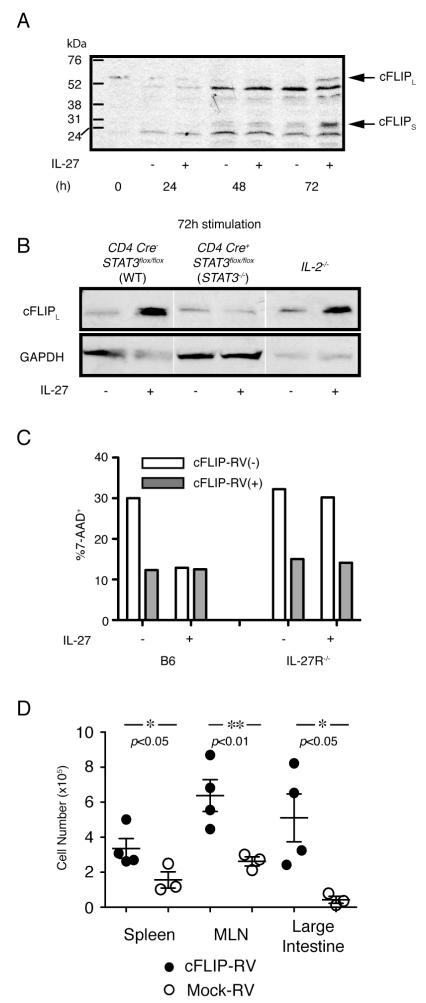
Figure 6.
IL-27 increases cFLIP expression through a STAT3-mediated pathway. (A) Western blotting for detections of cFLIP protein. MACS sorted CD4+CD25− cells were stimulated as in previous figures, in the presence or absence of rIL-27. Cells were harvested at the indicated time points, washed, counted, lysed and cell lysates were loaded for electrophoresis. Arrows in (A) indicate the bands for the two alternative forms of cFLIP, cFLIPL (59kDa) and cFLIPs (30kDa) (B) Western blotting analyses for detection of cFLIPL expressed by WT, STAT3−/− and IL-2−/− T cells, in the absence or presence of rIL-27. Bands representing cFLIP expression in each condition on the same gel exposure are shown. Cells were isolated, stimulated as above and harvested at 72 h. (A, B) Representative data from at least two experiments are shown. (C) WT B6 (left) or IL-27Rα−/− (right) naïve CD4+ T cells were stimulated in the presence or absence of IL-27 as described in Fig. 3, and infected with the pMSCV-cFLIP-IRES-hNGFR RV. Bars represent the percentage of 7-AAD+ cells in the cFLIP-RV− population (open bars; hNGFR−) and cFLIP-RV infected cells (gray bars: hNGFR+) cultured in the same wells. Data are representative from 2 independent experiments. (D) IL-27Rα−/− naïve CD4+ T cells were stimulated for 4 days and infected with pMSCV-cFLIP-IRES-GFP or Mock-RV. After the stimulation, 1.5×10⁶ FACS-sorted cFLIP-RV infected (n=4) or Mock-RV infected cells (n=3), detected as GFP+, were injected to Rag1−/− mice. Two weeks post transfer, the number of cFLIP-RV infected (closed circles) and Mock-RV infected (open circles) donor T cells in spleen, MLN and large intestine were calculated from the total cell number and the percentage of CD4+TCRβ+ cells. Horizontal bars represent the average number of 4 cFLIP-RV infected, and 3 Mock-RV infected donor cells in each organ. The p values calculated by Student’s t-tests are shown.

