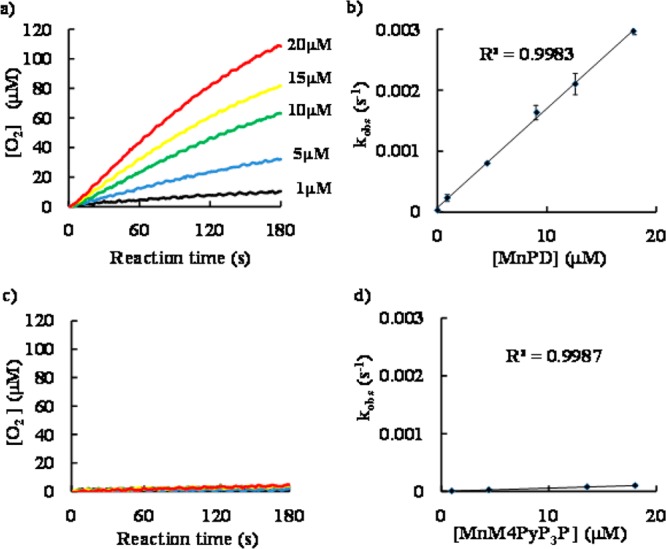
Figure 2.

Left: Time-course of O2 production from 1 mM H2O2 (final concentration) catalyzed by (a) MnPD and (c) MnM4PyP3P at 25 °C in 50 mM phosphate buffer (pH 7.4). The concentration of Mn-porphyrin was varied from 1 to 20 μM per Mn ions. Black, 1 μM; blue, 5 μM; green, 10 μM; yellow, 15 μM; red, 20 μM. Amount of O2 production was increased with increasing concentration of Mn-porphyrins. Five curves are almost overlapped in (c) MnM4PyP3P. Right: Plot of the observed rate constant (kobs) of (b) MnPD and (d) MnM4PyP3P as a function of the Mn-porphyrin concentration. kobs for each concentration of Mn-porphyrin was determined as a rate of O2 production in initial 5 s. kCAT value was determined as a mean value obtained from at least three experiments.
