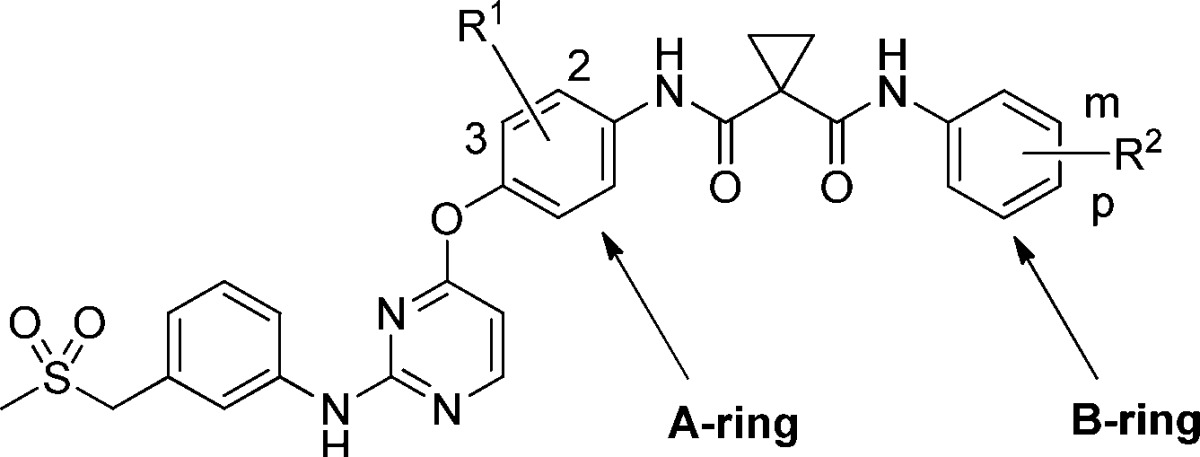
Table 1. SAR of A and B Ringsa.

| |
IC50 (nM)b |
|||
|---|---|---|---|---|
| Compd | R1 | R2 | VEGFR-2 | c-Met |
| 3a | H | H | 16.0 ± 4.0 | 8.8 ± 1.4 |
| 3b | H | p-F | 14.0 ± 2.0 | 7.9 ± 0.4 |
| 3c | H | p-Cl | 30.3 ± 4.2 | 32.5 ± 2.1 |
| 3d | H | p-Br | 61.5 ± 8.9 | 66.4 ± 11.2 |
| 3e | H | p-CH3 | 54.0 ± 15.5 | 18.6 ± 4.6 |
| 3f | H | p-CF3 | 219.9 ± 70.3 | 184.0 ± 34.8 |
| 3g | 2-F | p-F | 4.0 ± 0.5 | 13.1 ± 1.6 |
| 3h | 3-F | p-F | 6.0 ± 1.0 | 6.7 ± 0.7 |
| 3i | 3-F | p-Br | 46.6 ± 5.9 | 70.6 ± 0.9 |
| 3j | 3-F | p-OCH3 | 6.1 ± 1.6 | 337.6 ± 4.1 |
| 3k | 3-F | m-OCH3 | 5.6 ± 0.1 | 683.1 ± 58.0 |
| 3l | 3-F | m-CH3 | 42.7% @ 10 μM | 81.9 ± 16.9 |
| 3m | 3-F | H | 12.7 ± 2.8 | 25.8 ± 7.7 |
| 3n | 3-F | m-F | 43.0 ± 7.0 | 155.1 ± 19.4 |
| 3o | 3-F | m-Cl | 9.8 ± 0.3 | 212.7 ± 9.7 |
| 3p | 3-F | m-CF3 | 48.0 ± 8.0 | 234.3 ± 22.2 |
| 3q | 3-F | m-CF3, p-Cl | 83.6 ± 0.9 | 791.9 ± 169.2 |
| 3r | 3-F | m-CF3, p-CN | 44.5 ± 7.5 | 17.7% @ 10 μM |
See Supporting Information for a description of the assay conditions.
c-Met IC50 of PF2341066 = 1.5 ± 0.3 nM; VEGFR-2 IC50 of AP24534 = 4.3 ± 0.4 nM.
