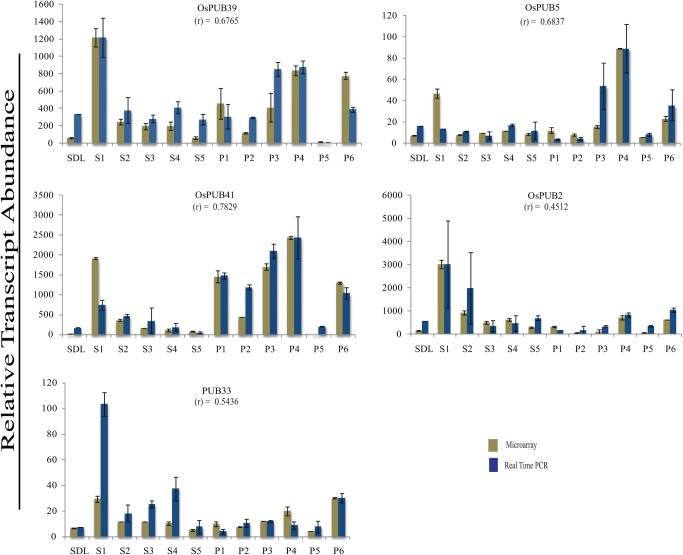
Figure 7.
Validation of expression profiles for selected OsARM genes in developmental stages by Q-PCR. Q-PCR analysis performed for selected genes to validate their expression profiles during various stages of development. Standard error bars have been shown for data obtained both from microarray and Q-PCR. Y-axis represents raw expression values from microarray and normalized expression value from Q-PCR and X-axis shows different experimental conditions.SDL, seedling; S1–S5, stages of seed development; P1–P6, stages of panicle development.

