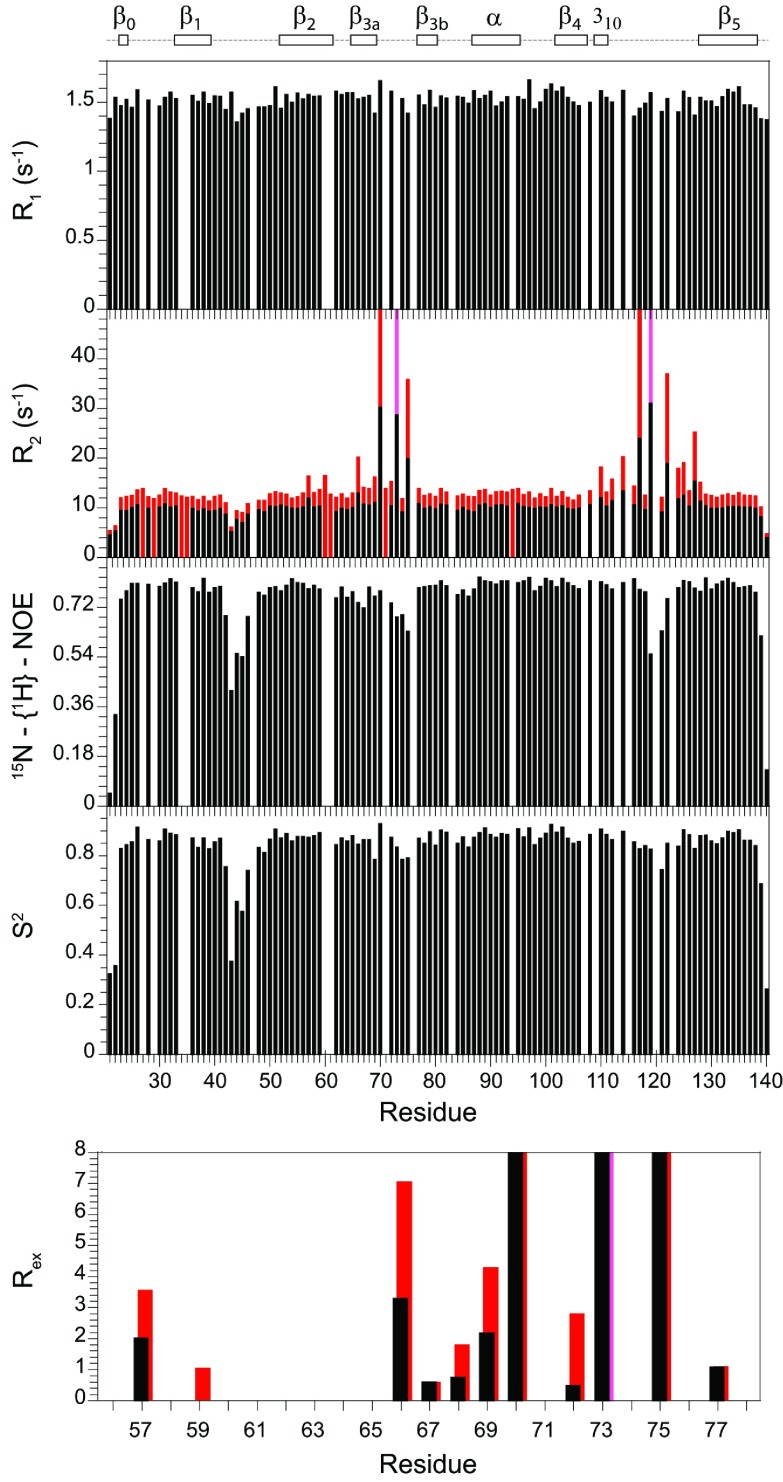
Figure 3. 15N relaxation measurements for the backbone amide resonances in the FK1 domain of FKBP51 at 25°C.
The longitudinal (R1) and transverse (R2) relaxation rates at 600 MHz 1H are shown with the transverse relaxation rates at 900 MHz 1H also indicated in red. The R2 values at 900 MHz for Arg73 and Leu119 are illustrated in pink, indicating rates that are significantly above 50 s−1 for which the attenuated resonances could not be reliably quantified. The heteronuclear NOE and model-free [48,49] order parameters (S2) are also illustrated along with the conformational exchange line-broadening Rex values for residues extending from within the β2 strand to the end of the β3 bulge. Rex values for Ser70, Arg73 and Glu75 are truncated to better illustrate the smaller line-broadening effects in the β2 and β3a strands. In addition to proline residues, relaxation data are not reported for overlapped resonances and for the severely broadened resonances of Tyr113 and Ser115.

