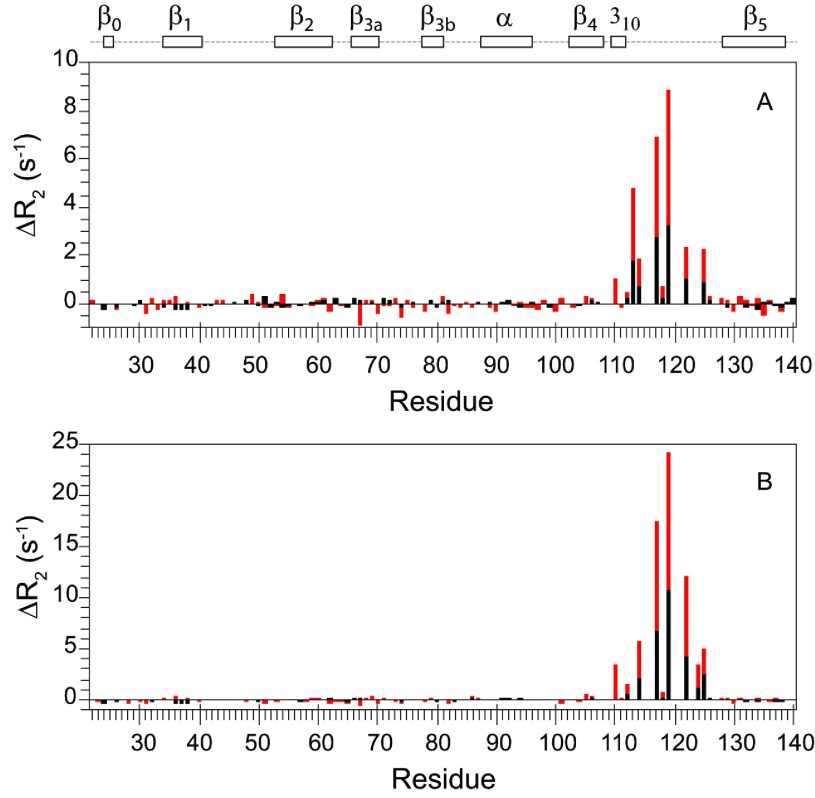
Figure 8. Differential 15N transverse relaxation measurements for the P119L and P119L/P124S variants of FKBP52 compared with the wild-type protein.
Relative to wild-type FKBP52, the differential transverse relaxation rates at 600 MHz (black) and higher field (red) are shown for P119L (A) and P119L/P124S (B). At each field, the median R2 values for the two datasets are scaled to correct for small variations in the global molecular correlation times. The higher field data for the two variants of FKBP52, collected at 800 MHz, were scaled to the wild-type FKBP52 data at 900 MHz under the assumption that the conformational exchange occurs in the fast limit regime. Outside the region exhibiting significant differential line-broadening (i.e. residues 110–125), the RMSD for the ΔR2 values were 0.13 and 0.18 s−1 for 600 MHz and higher field data for the P119L/P124S variant comparison respectively. The ΔR2 values for Leu119 and Ser124 are given relative to the median R2 value.

