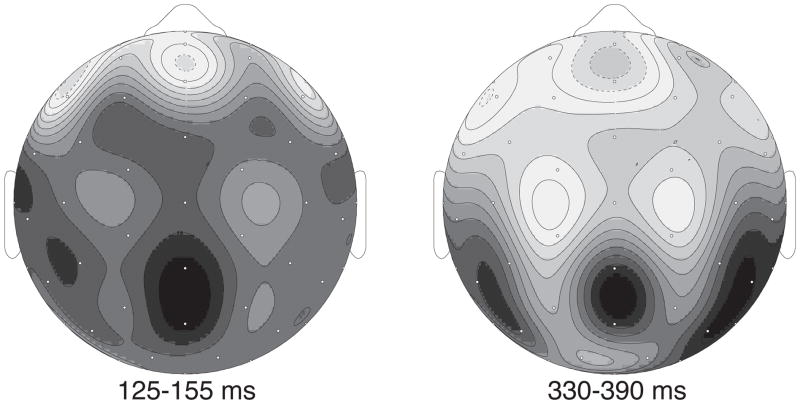
Figure 1.
Distribution of the word frequency effect. The map on the left depicts the distribution of the word frequency effect around the peak of the P2 component. The map on the right depicts the distribution of the same effect around the peak of the N400 component. In both time windows the effect is especially large over midline parietal electrode sites. This observation motivated the selection of electrode sites for the present study.

