
Figure 3.
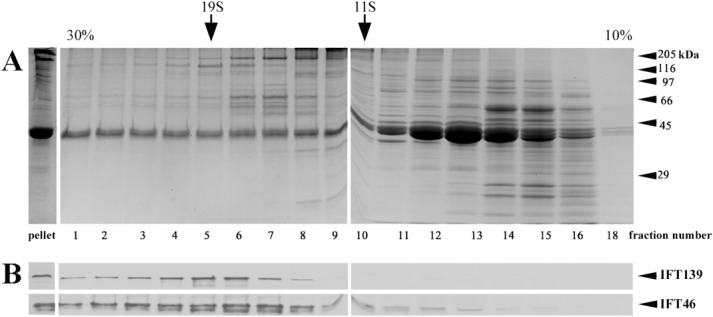
Sucrose density gradient profile of the flagellar membrane plus matrix fraction. A. Coomassie blue staining. B. IFT139 and IFT46 immunostaining. Arrows mark the sedimentation position of thyroglobulin (19S) and catalase (11S); arrowheads indicate the electrophoretic migration of molecular weight standards (in kDa).