
Figure 9.
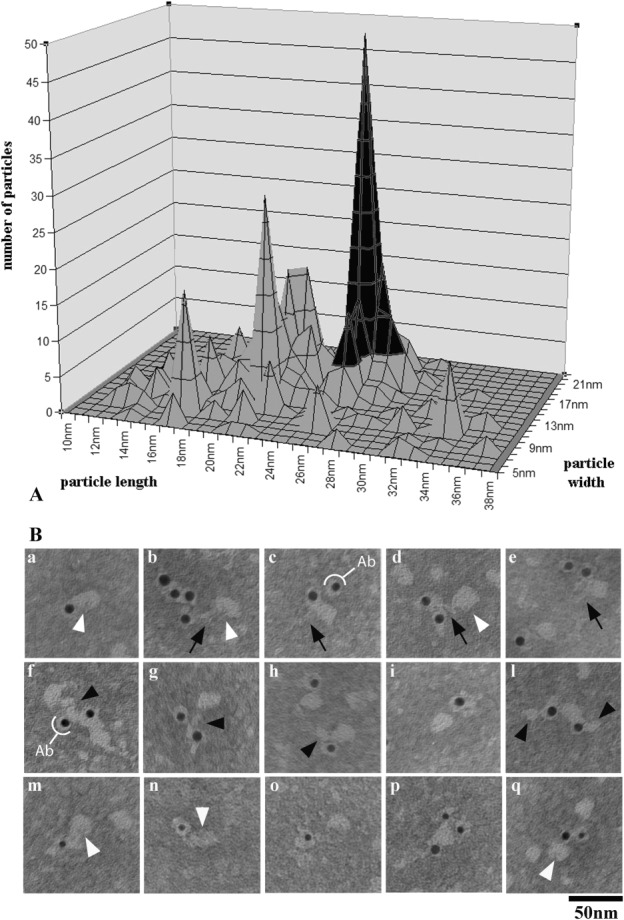
Immunolabeling of 17S IFT particles. A. Size distribution analysis of labeled, soluble particles occurring in the gradient IFT peak fractions. Both axes (width and length) of each labeled particle were measured; the graph was obtained by plotting the number of counted particles for each pair of length/width values, for a total of 602 soluble particles counted. The graph includes all the labeled particles we measured, since no significant difference in the labeling obtained using the IFT46 and the IFT139 antibody was observed. Particles sizes clustered into a few discrete peaks, with the peak in black being the major peak. B. Representative, labeled particles from the major peak of the graph shown in A. Particles are labeled by the IFT46 antibody (a–l, 10-nm gold particles), by the IFT139 antibody (m–o, 5-nm gold particles) or by both antibodies (p–q). Ovoid particles, about 26 × 17 nm in size, show a thin stem (black arrows) and a small indentation (white arrowheads), and are often associated with smaller particles (arrowheads). The white semicircles indicate the antibody molecule associated with the gold particle.