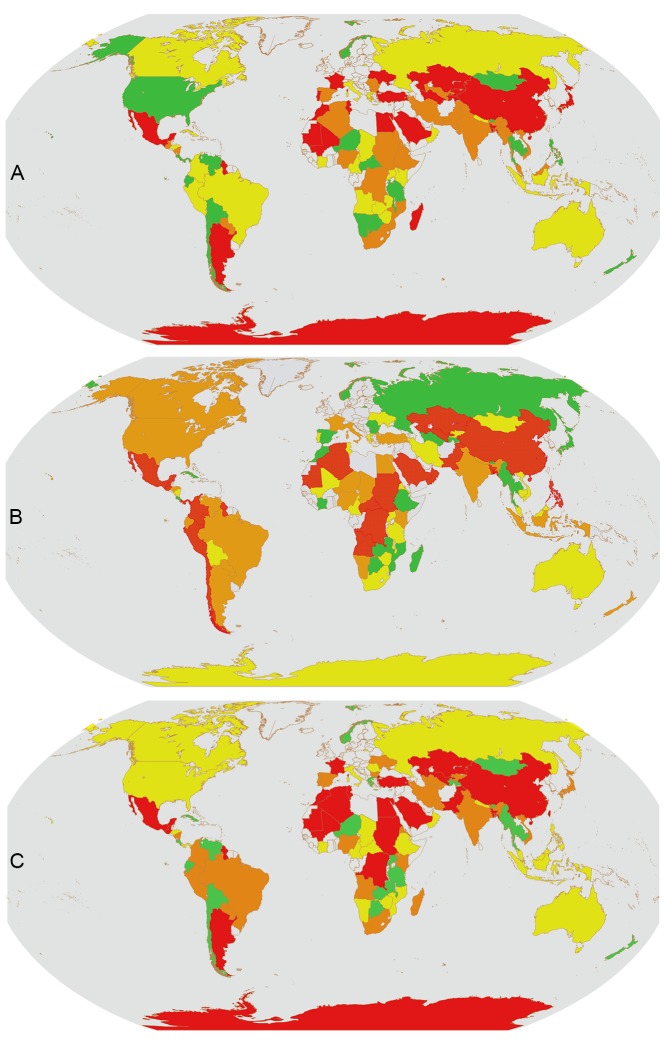
Figure 2. Three measures of protected-area coverage of 83 countries and Antarctica.
(A) Total percentage of land protected, (B) protection equality (adapted Gini-coefficient), and (C) integrated protection (the product of A and B). Countries are classified into different coloured quartiles: green = highest quartile, yellow = second highest quartile, orange = second lowest quartile, and red = lowest quartile.

