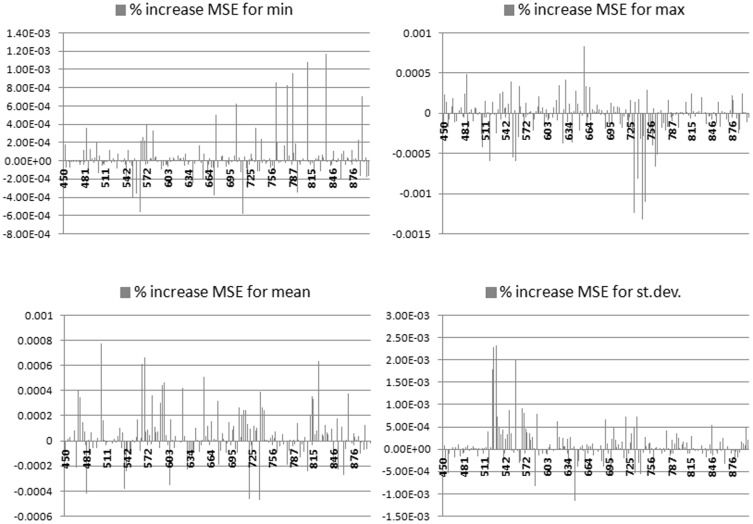
Figure 5. Ranking of hyperspectral metrics, a way to identify the regions most contributing to model success, with maximum, minimum, mean, standard deviation of band reflectance in the four different frames of the figure.
The y-axis represents the percentage increase in OOB- MSE and the x-axis is the band region (in nm).

