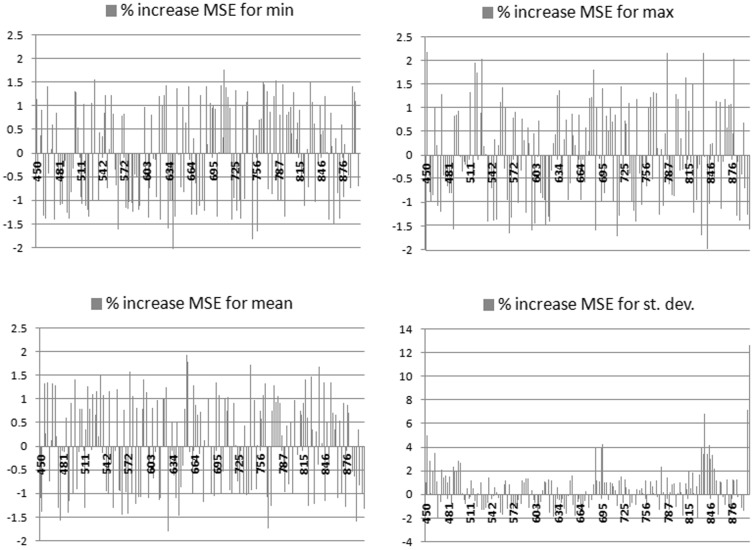
Figure 6. Ranking of derivative metrics, a way to identify the regions most contributing to model success, with maximum, minimum, mean, standard deviation of first derivatives of band reflectance in the four different frames of the figure.
The y-axis represents the percentage in increase in MSE and the x-axis is the band region (in nm).

