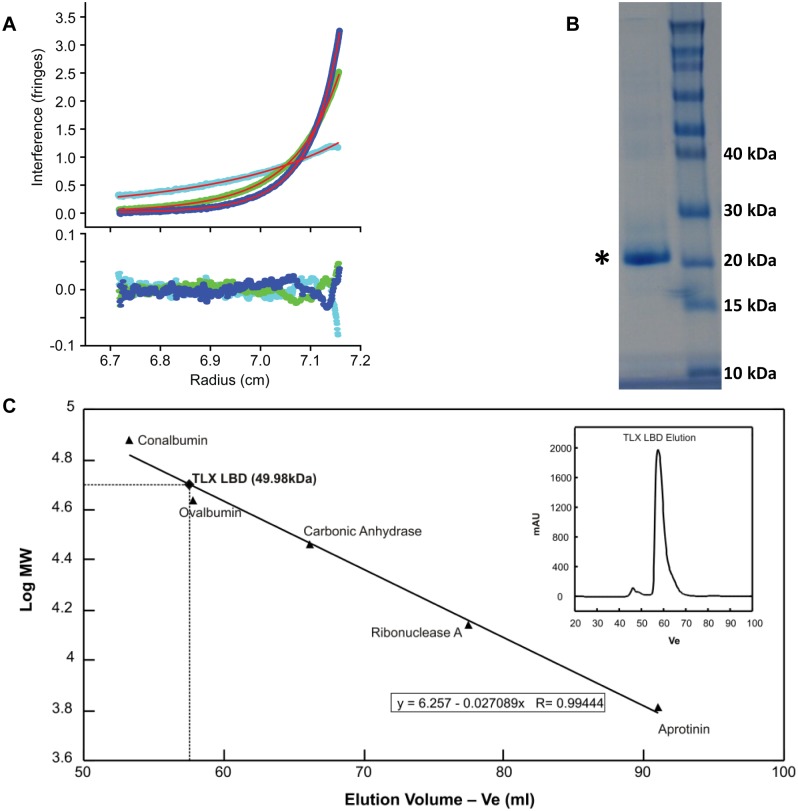
Figure 3. Biochemical characterization of purified TLX LBD. A.
Analytical ultracentrifugation sedimentation analysis on purified TLX LBD. Analytical ultracentrifugation sedimentation equilibrium profiles were recorded at 4°C after 70 hour incubation at three rotor speeds: 11,000 r.p.m. (cyan), 18,000 r.p.m. (green) and 22,000 r.p.m. (blue), for a 10 µM TLX sample, dissolved in 20 mM Tris-HCl, 150 mM NaCl, 5 mM DTT, 10% (v/v) glycerol, 1% (v/v) DMSO and 2 mM CHAPS at pH 8.0. The upper panel shows the sedimentation equilibrium profiles with the lines of best fit shown in red. The best fit was obtained for a monomer-dimer equilibrium model with a Kd of 10 µM. 95% confidence interval limits for this dissociation constant were determined to be 4 µM<Kd<24 µM. The lower panel provides, for each dataset, the residuals for the data fitting. This is an illustration on how accurate the fitting actually is. B. This panel represents the SDS page gel for the pooled fractions of purified TLX LBD protein after size-exclusion chromatography (first column, shown with the asterisk). The protein ladder appears in the second column. In presence of this denaturing gel, TLX LBD runs at a molecular weight of 25 KDa, corresponding to the molecular weight for the monomeric TLX LBD. C. This panel is an illustration of the size-exclusion calibration curve. TLX LBD elutes at a volume corresponding to a dimer. In the inset window is shown the size-exclusion chromatogram for TLX LBD. TLX LBD elutes as a sharp symmetric peak.

